B Plots
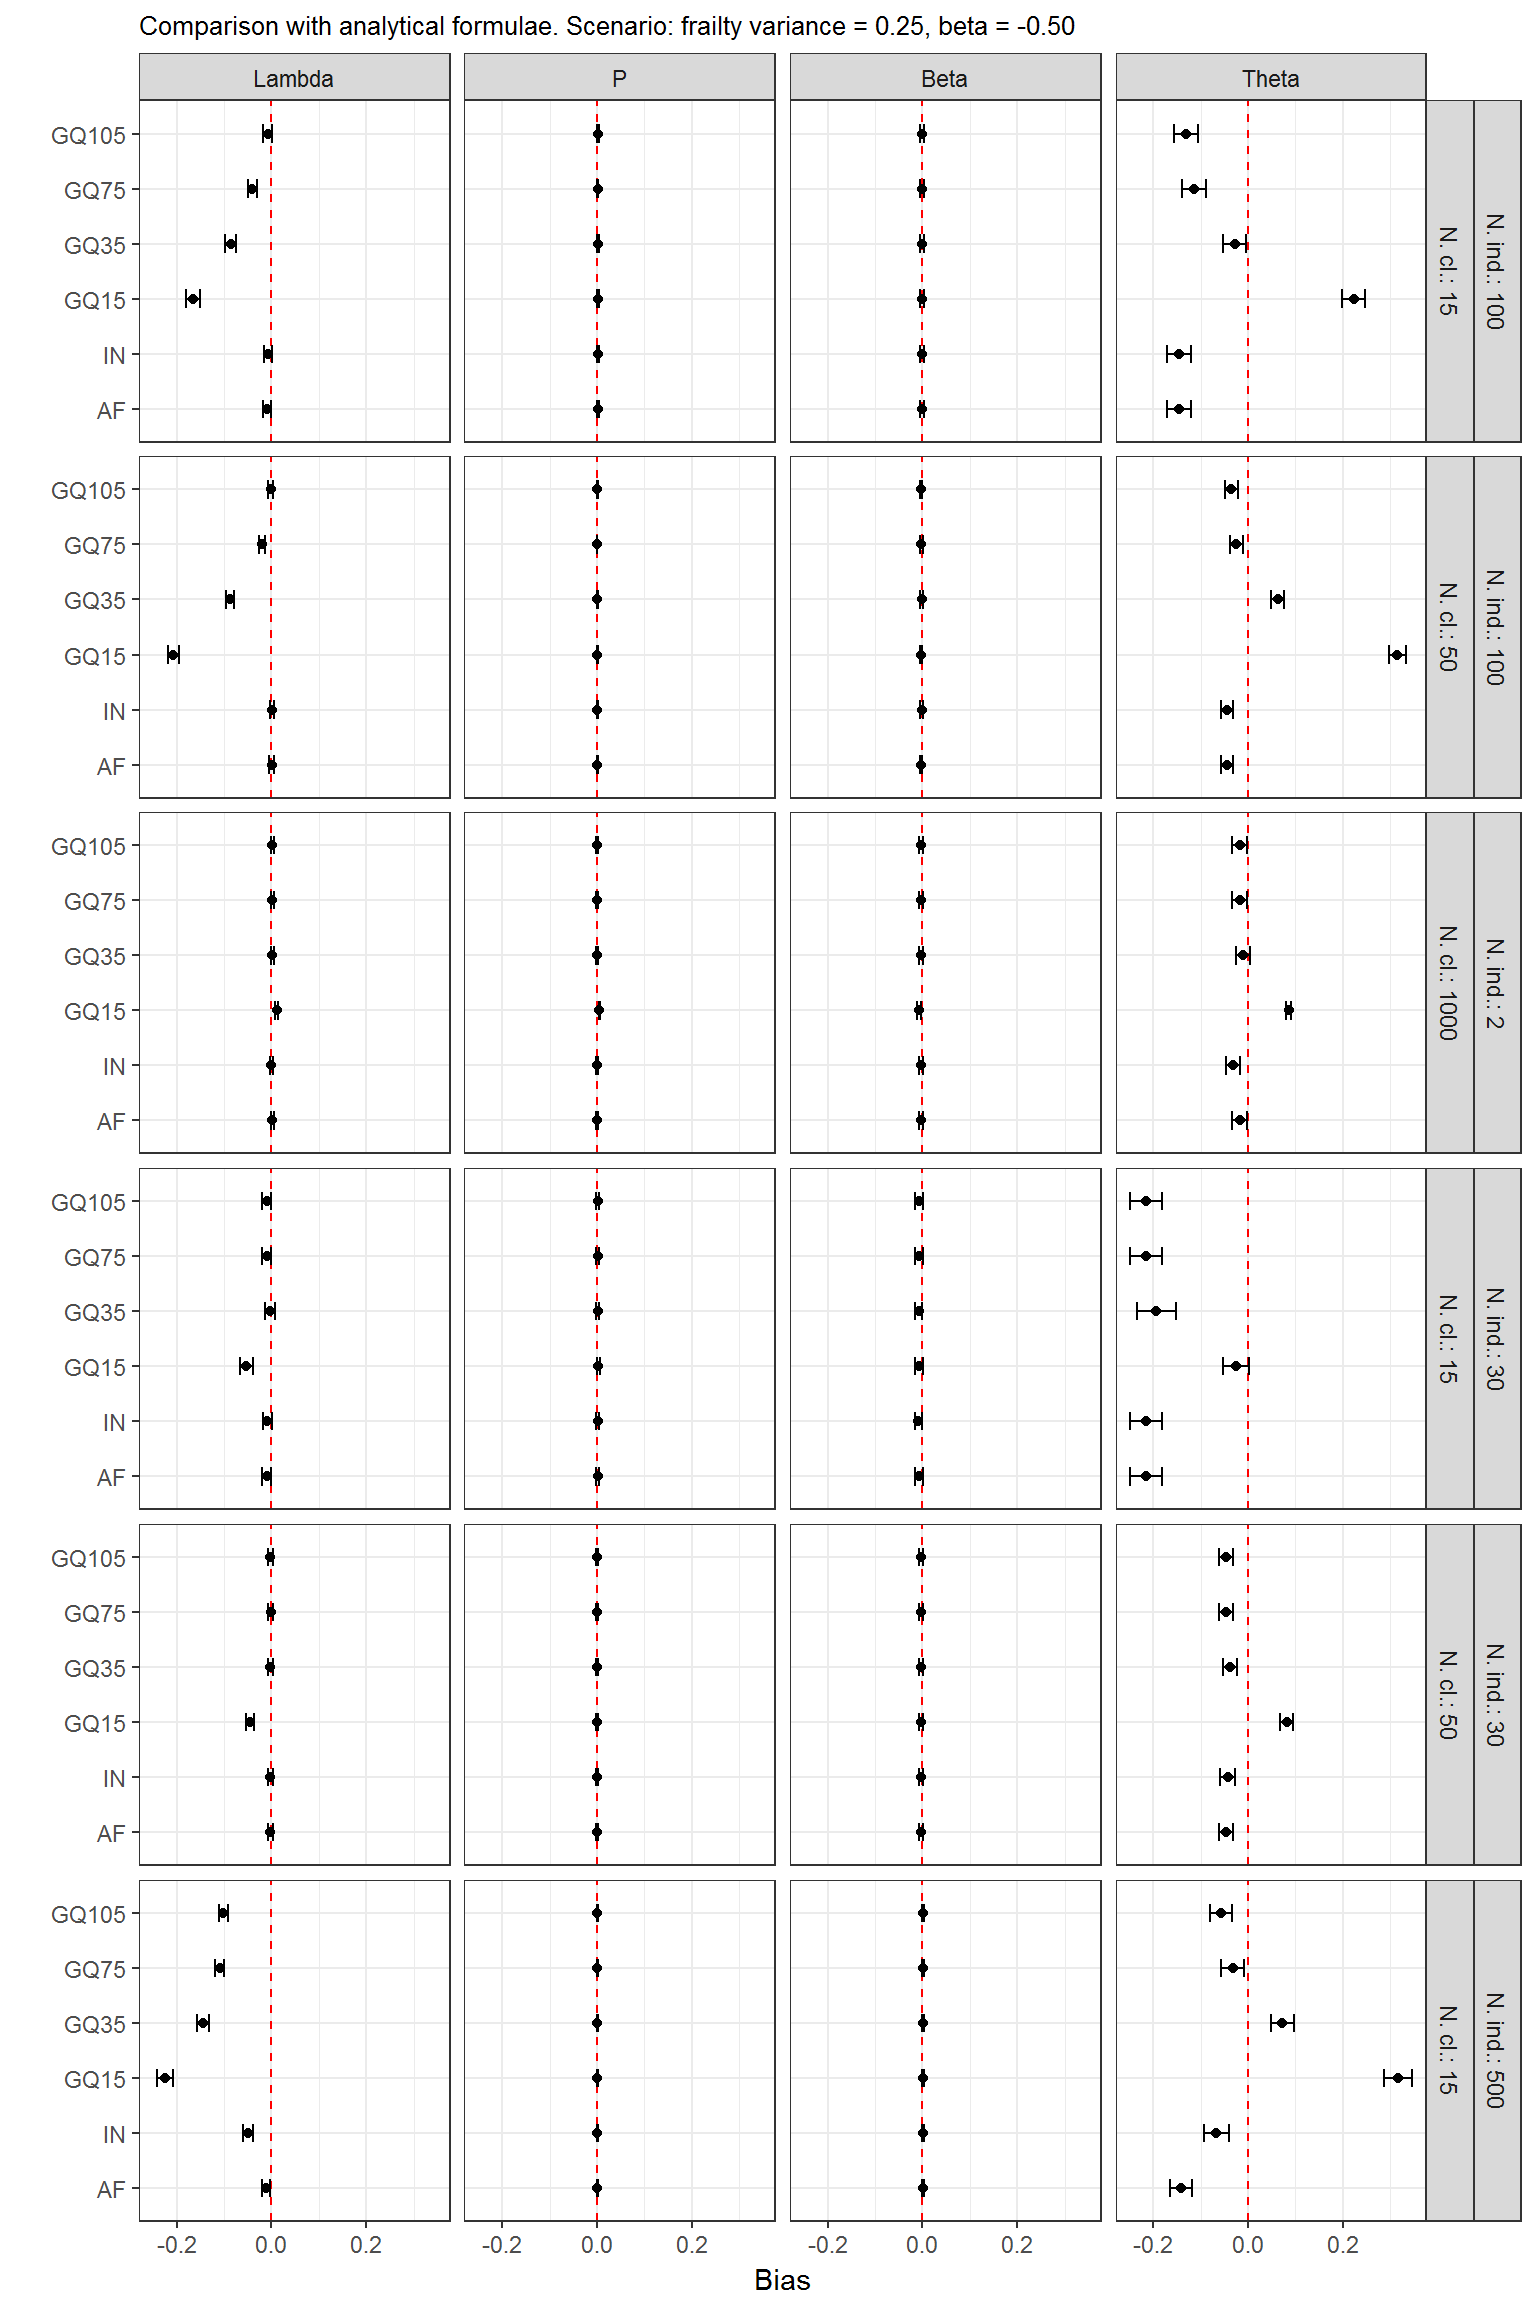
Figure B.1: Bias, comparison with analytical formulae, scenario with a small frailty variance and a negative regression coefficient.
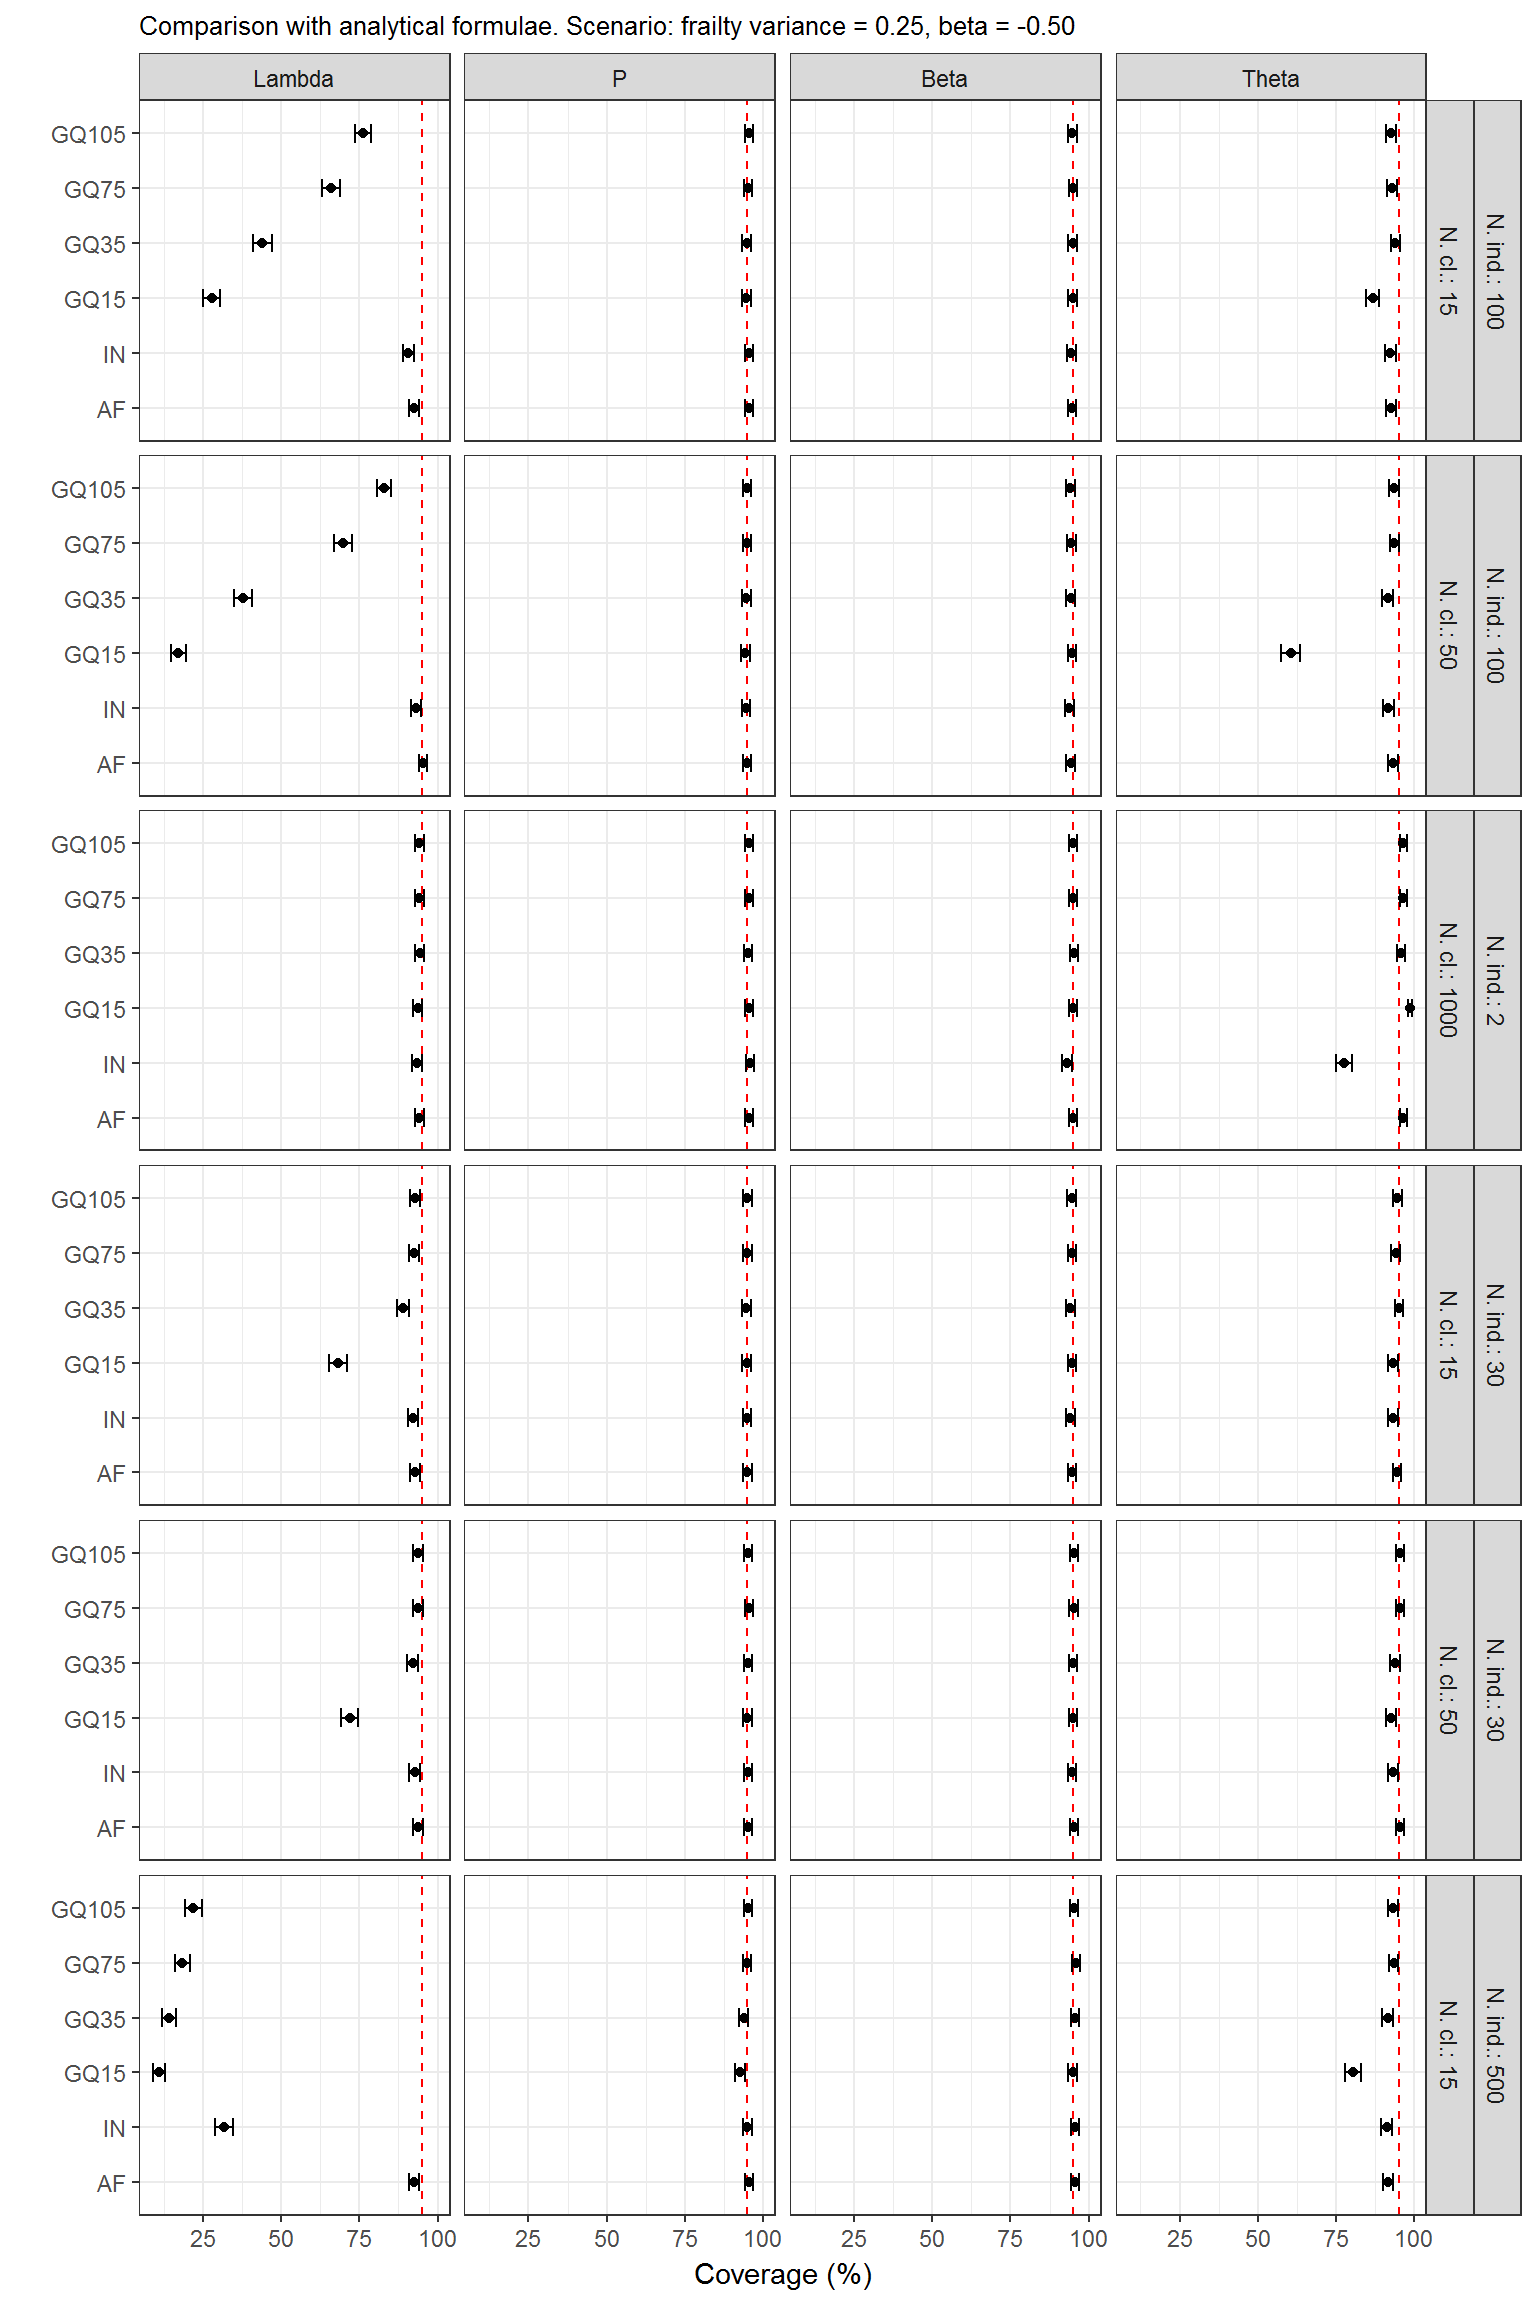
Figure B.2: Coverage, comparison with analytical formulae, scenario with a small frailty variance and a negative regression coefficient.
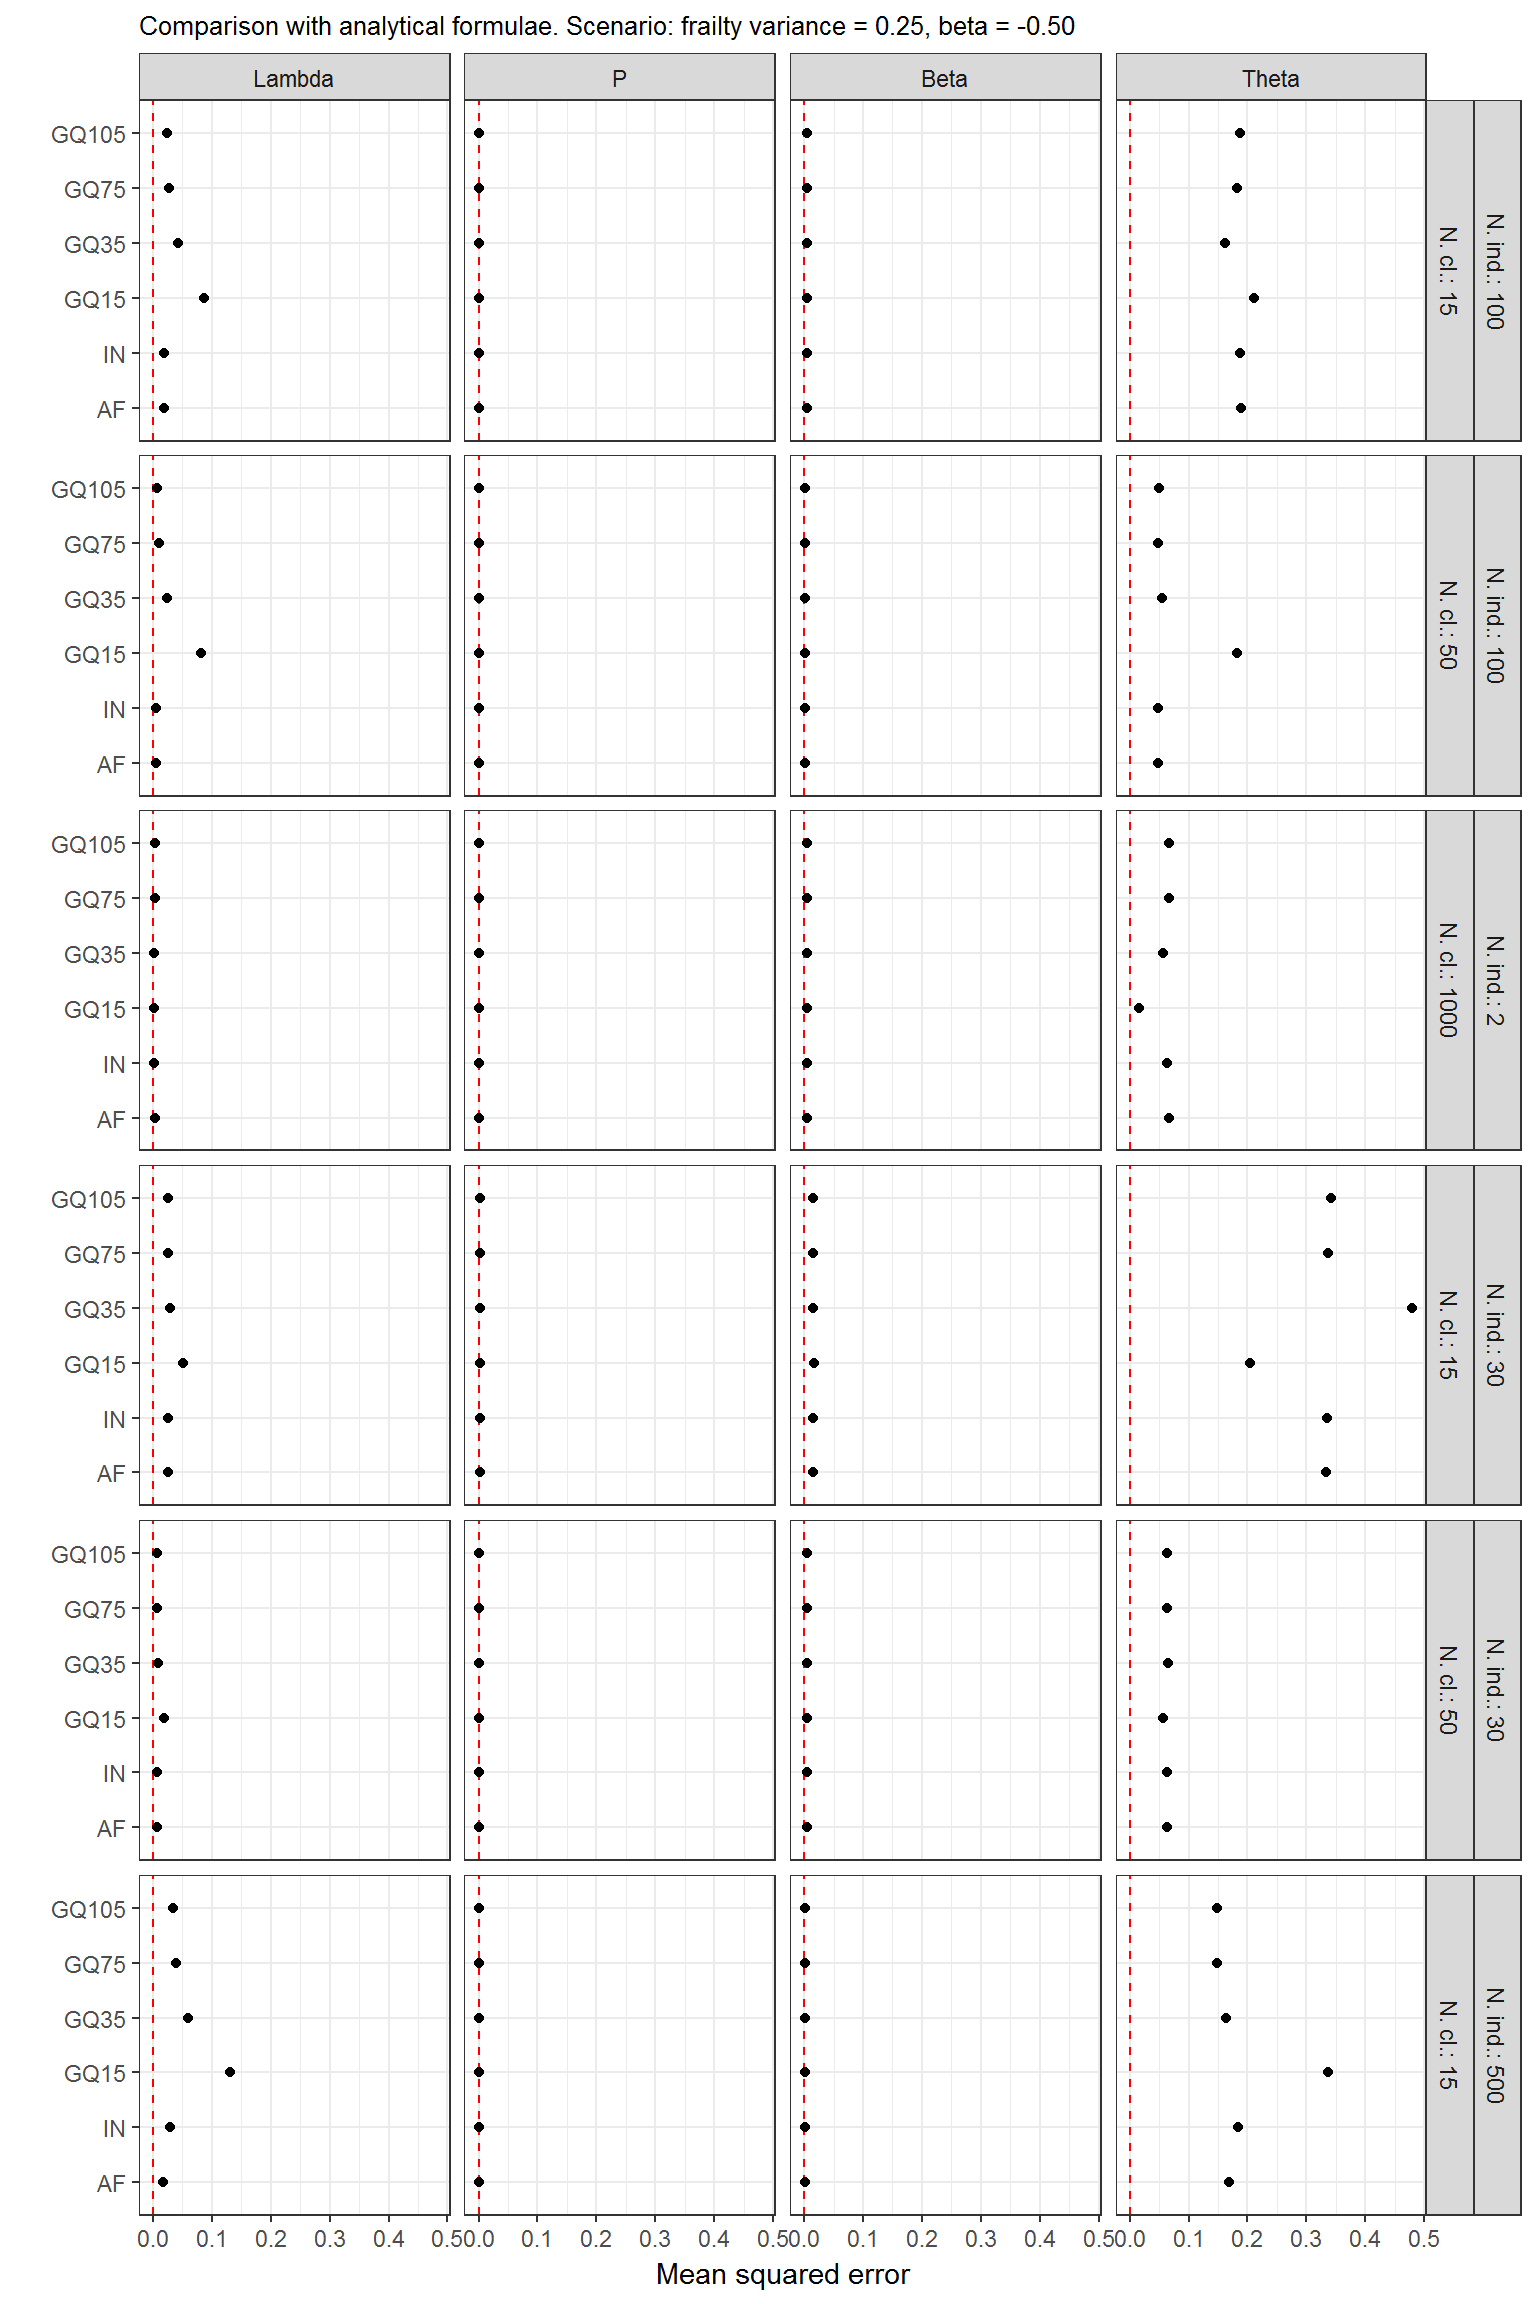
Figure B.3: Mean squared error, comparison with analytical formulae, scenario with a small frailty variance and a negative regression coefficient.
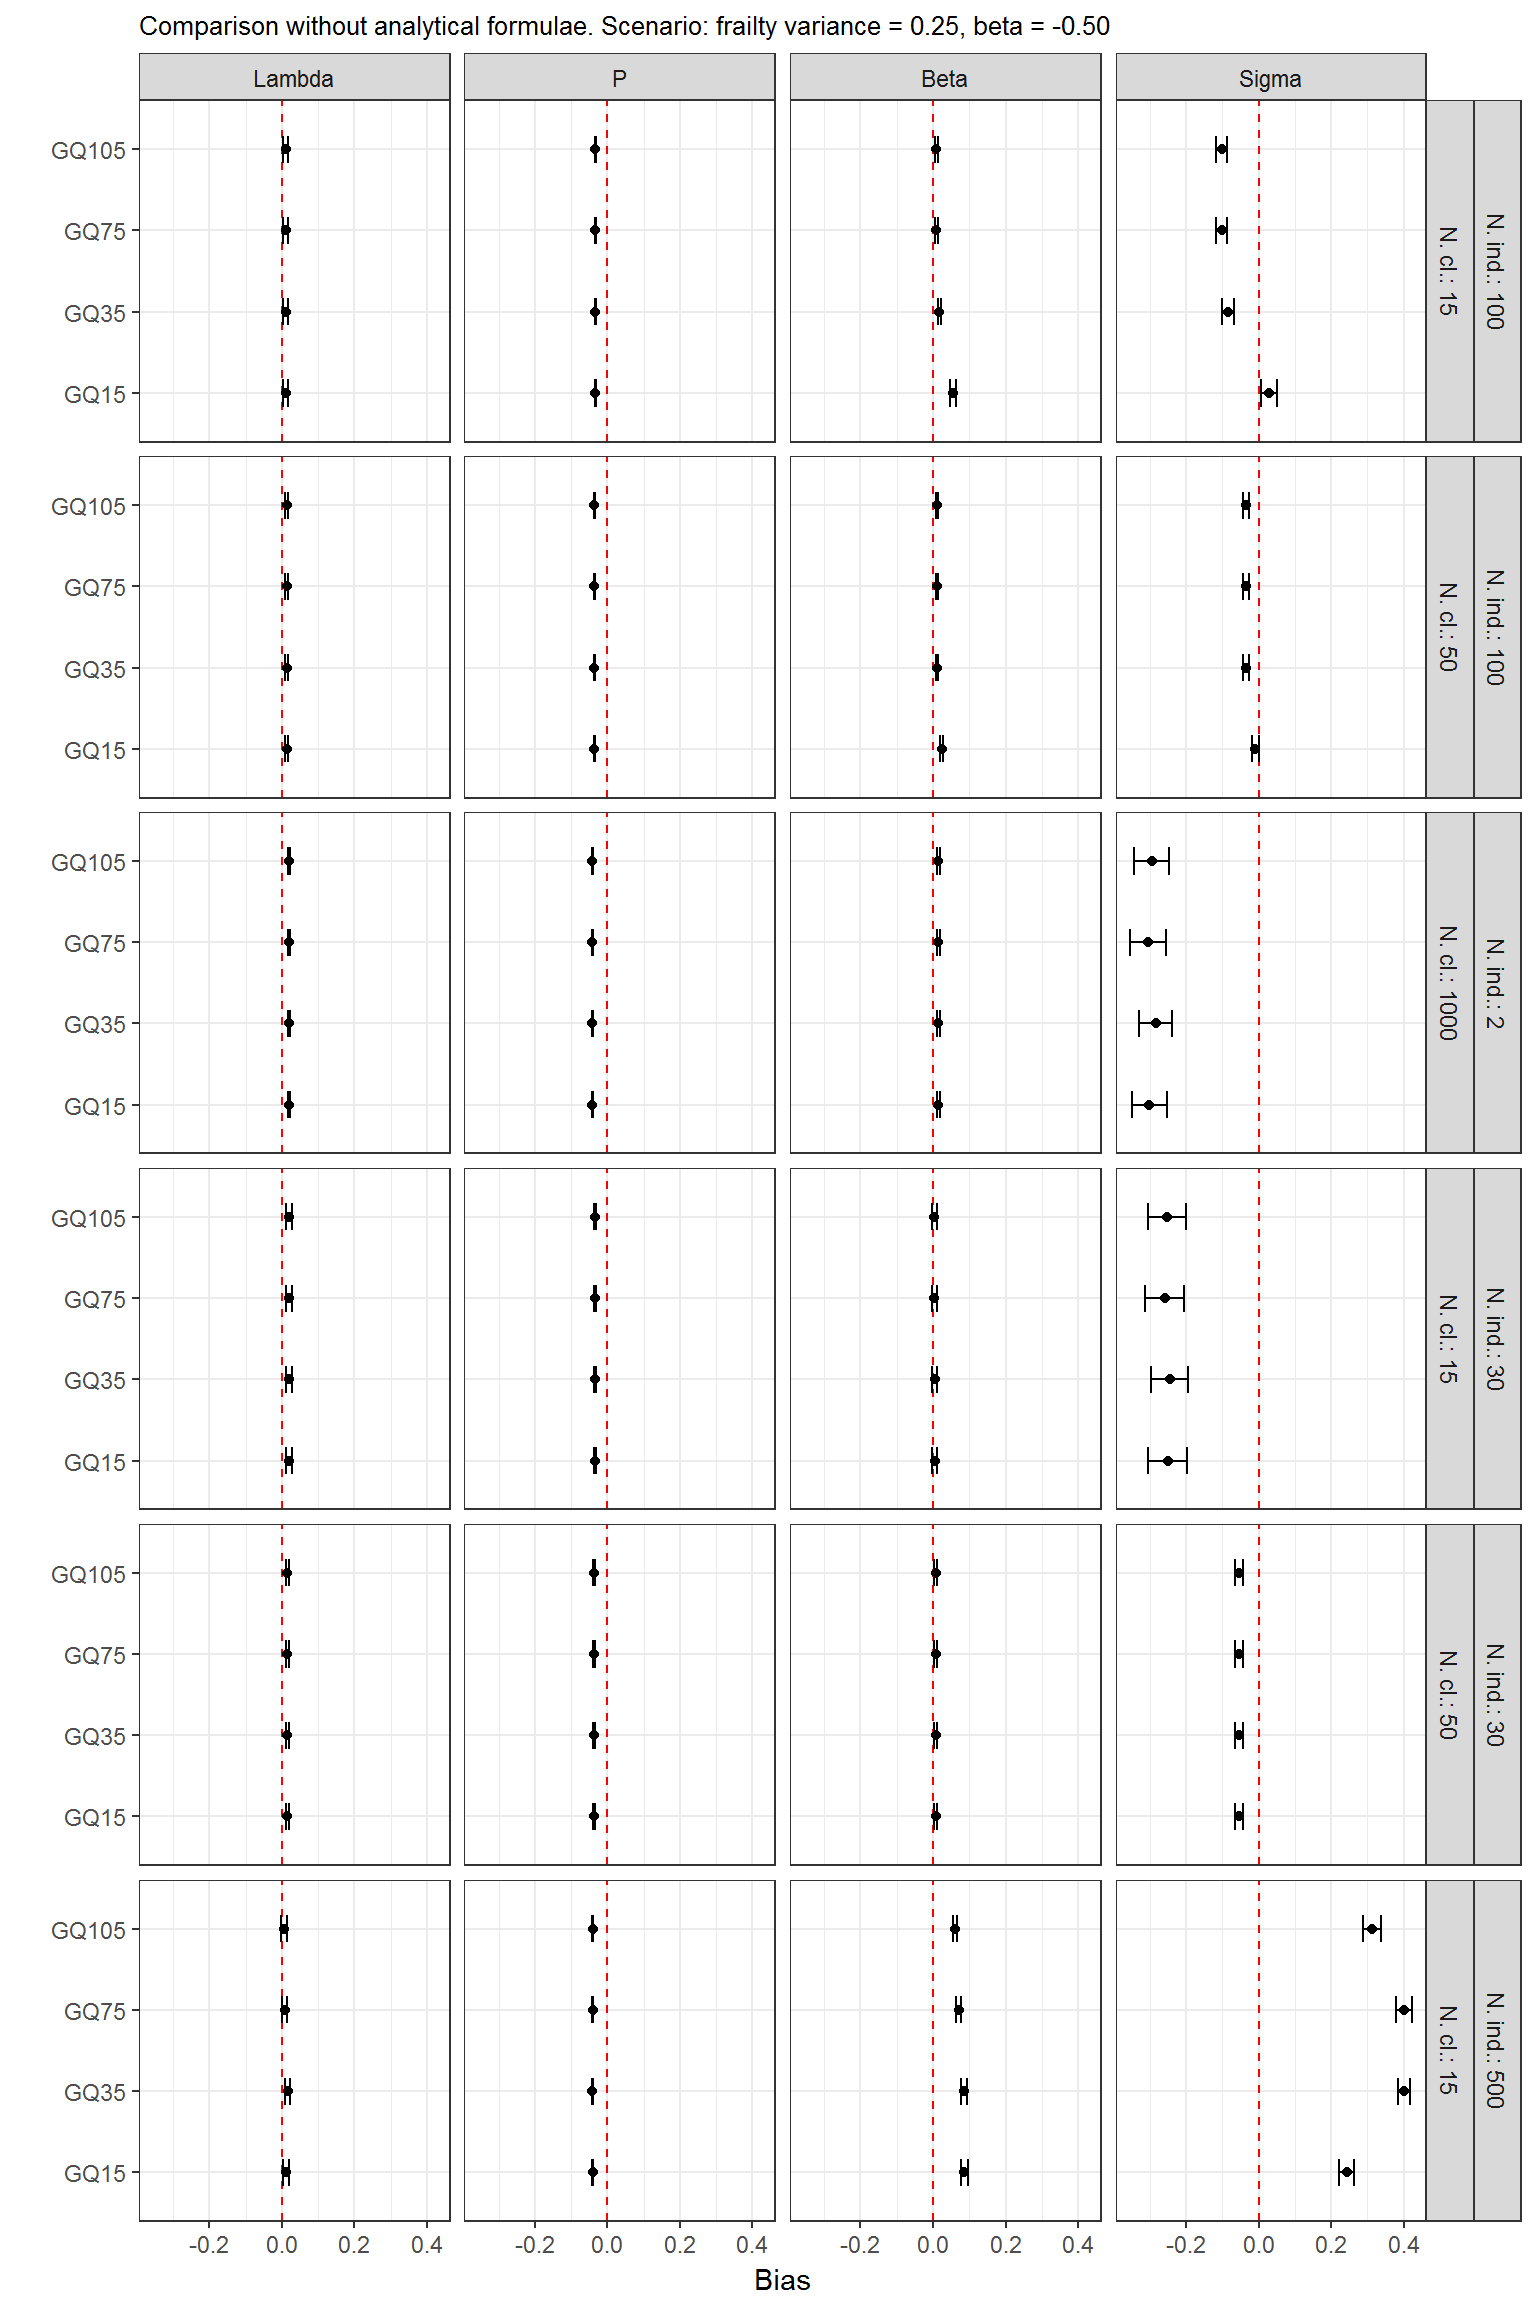
Figure B.4: Bias, comparison without analytical formulae, scenario with a small frailty variance and a negative regression coefficient.
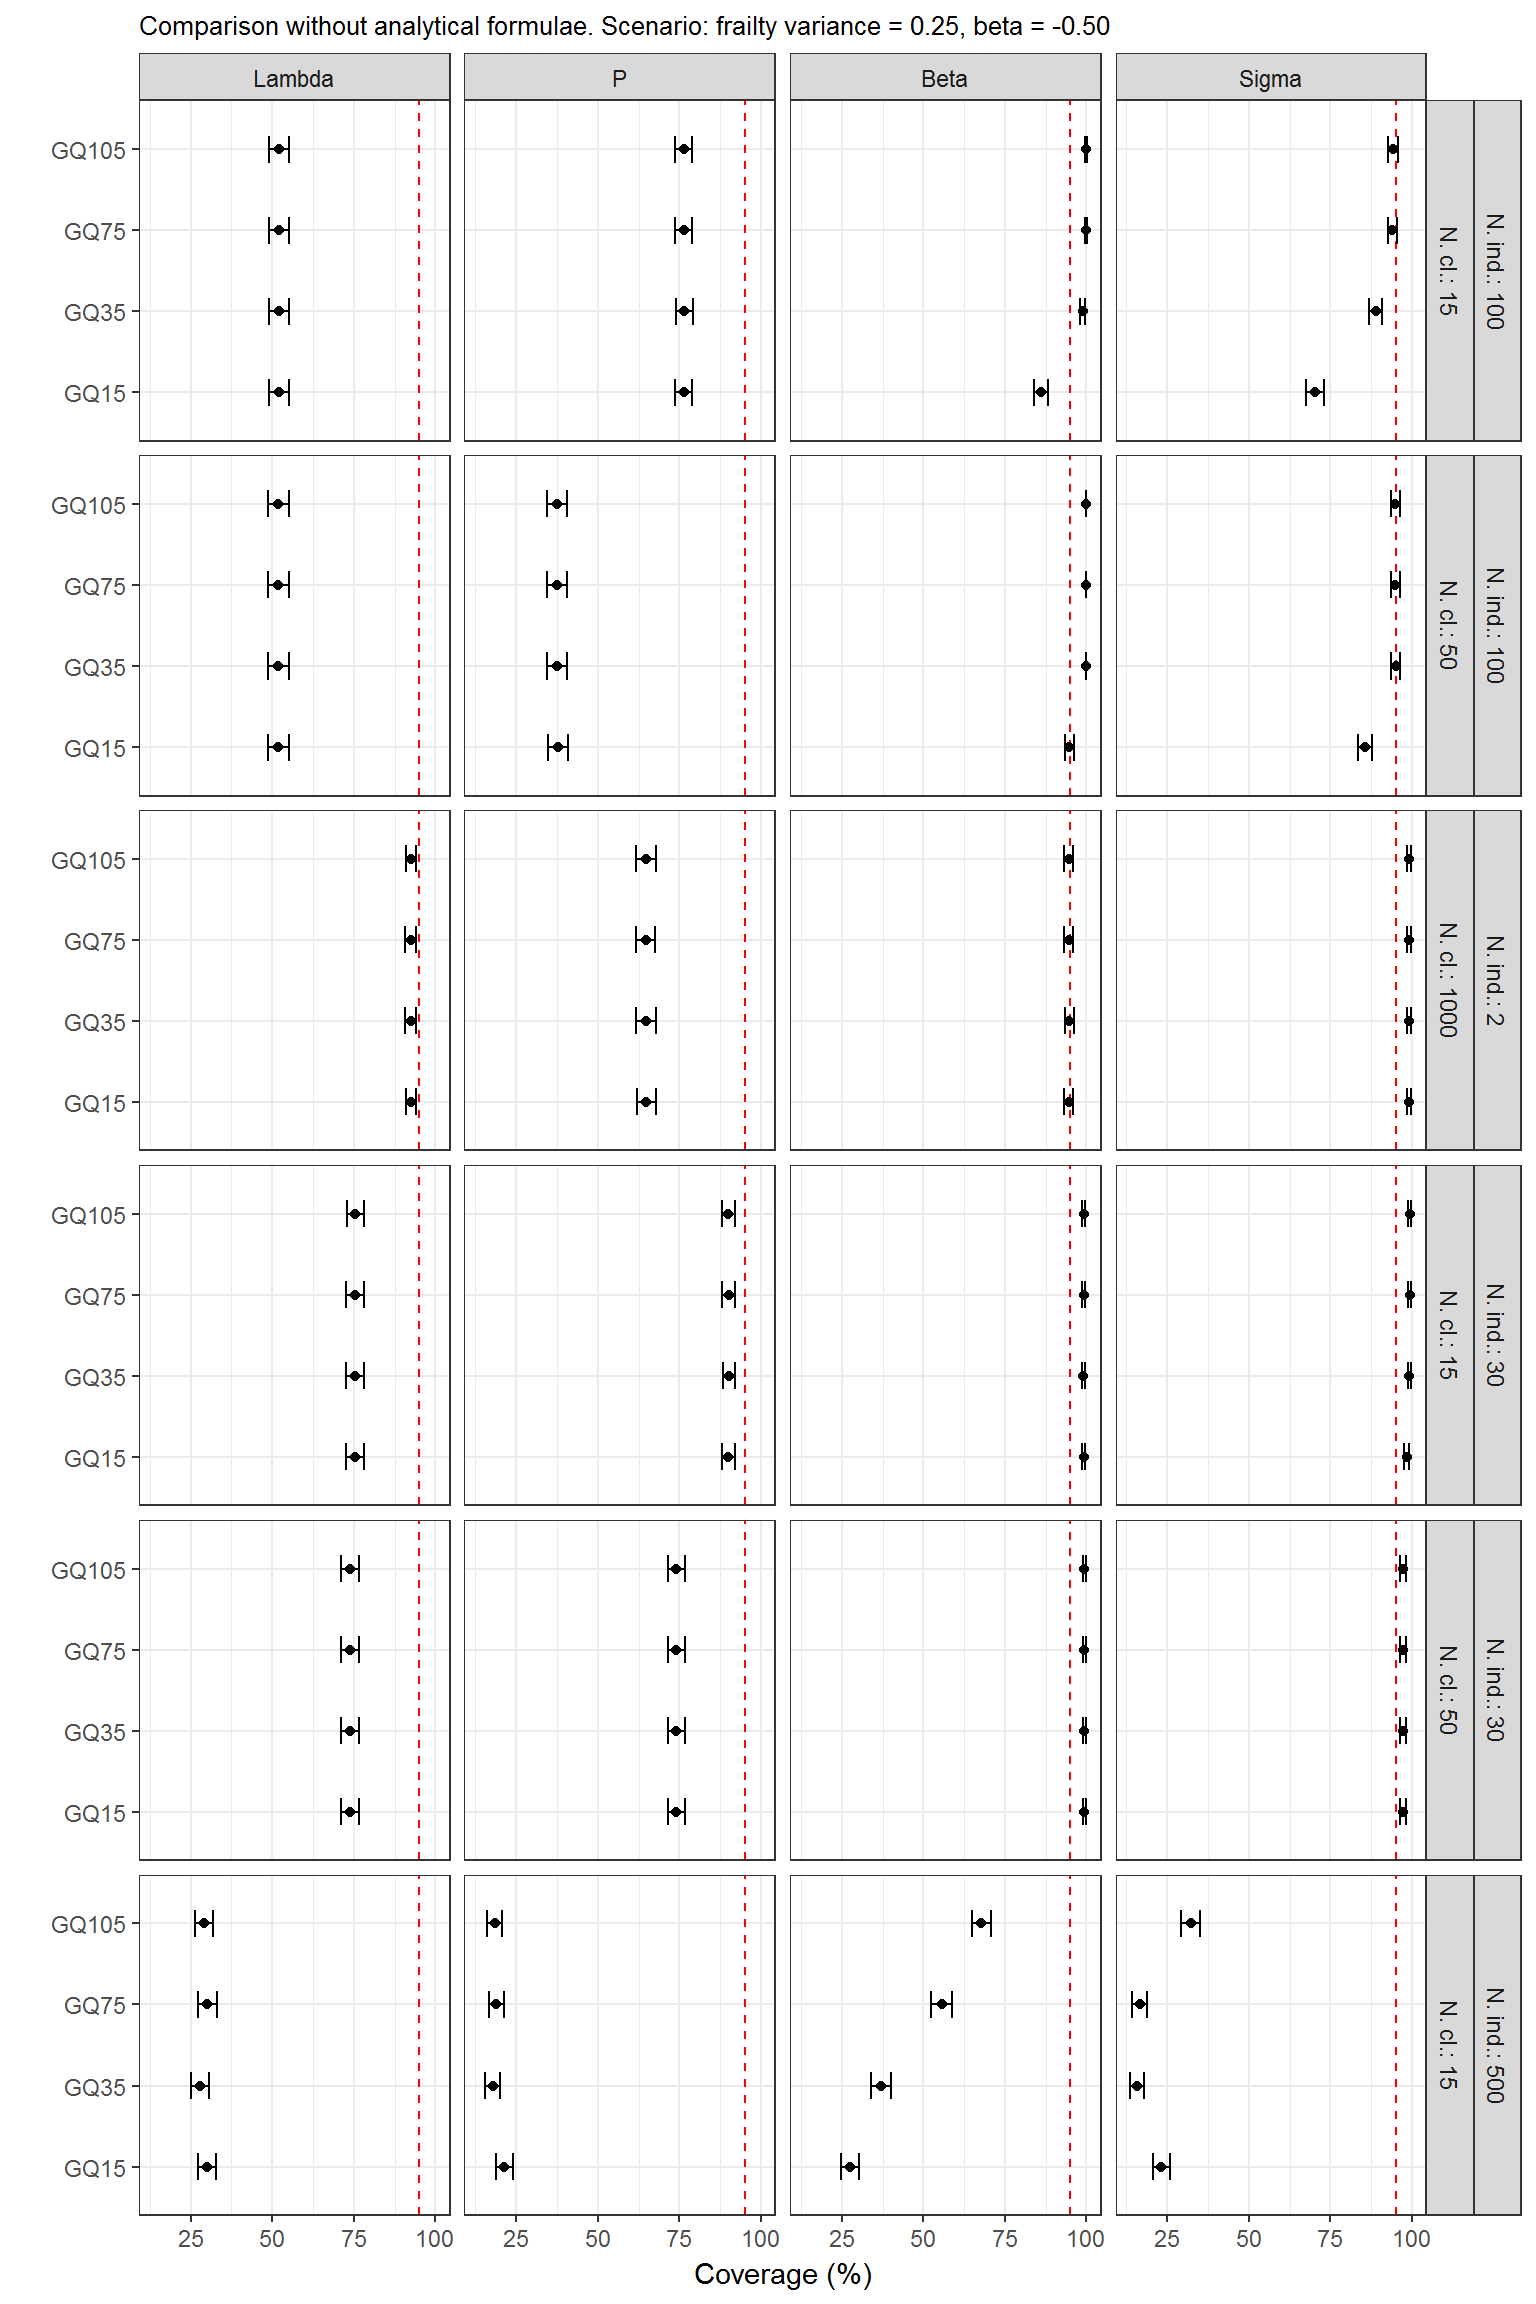
Figure B.5: Coverage, comparison without analytical formulae, scenario with a small frailty variance and a negative regression coefficient.
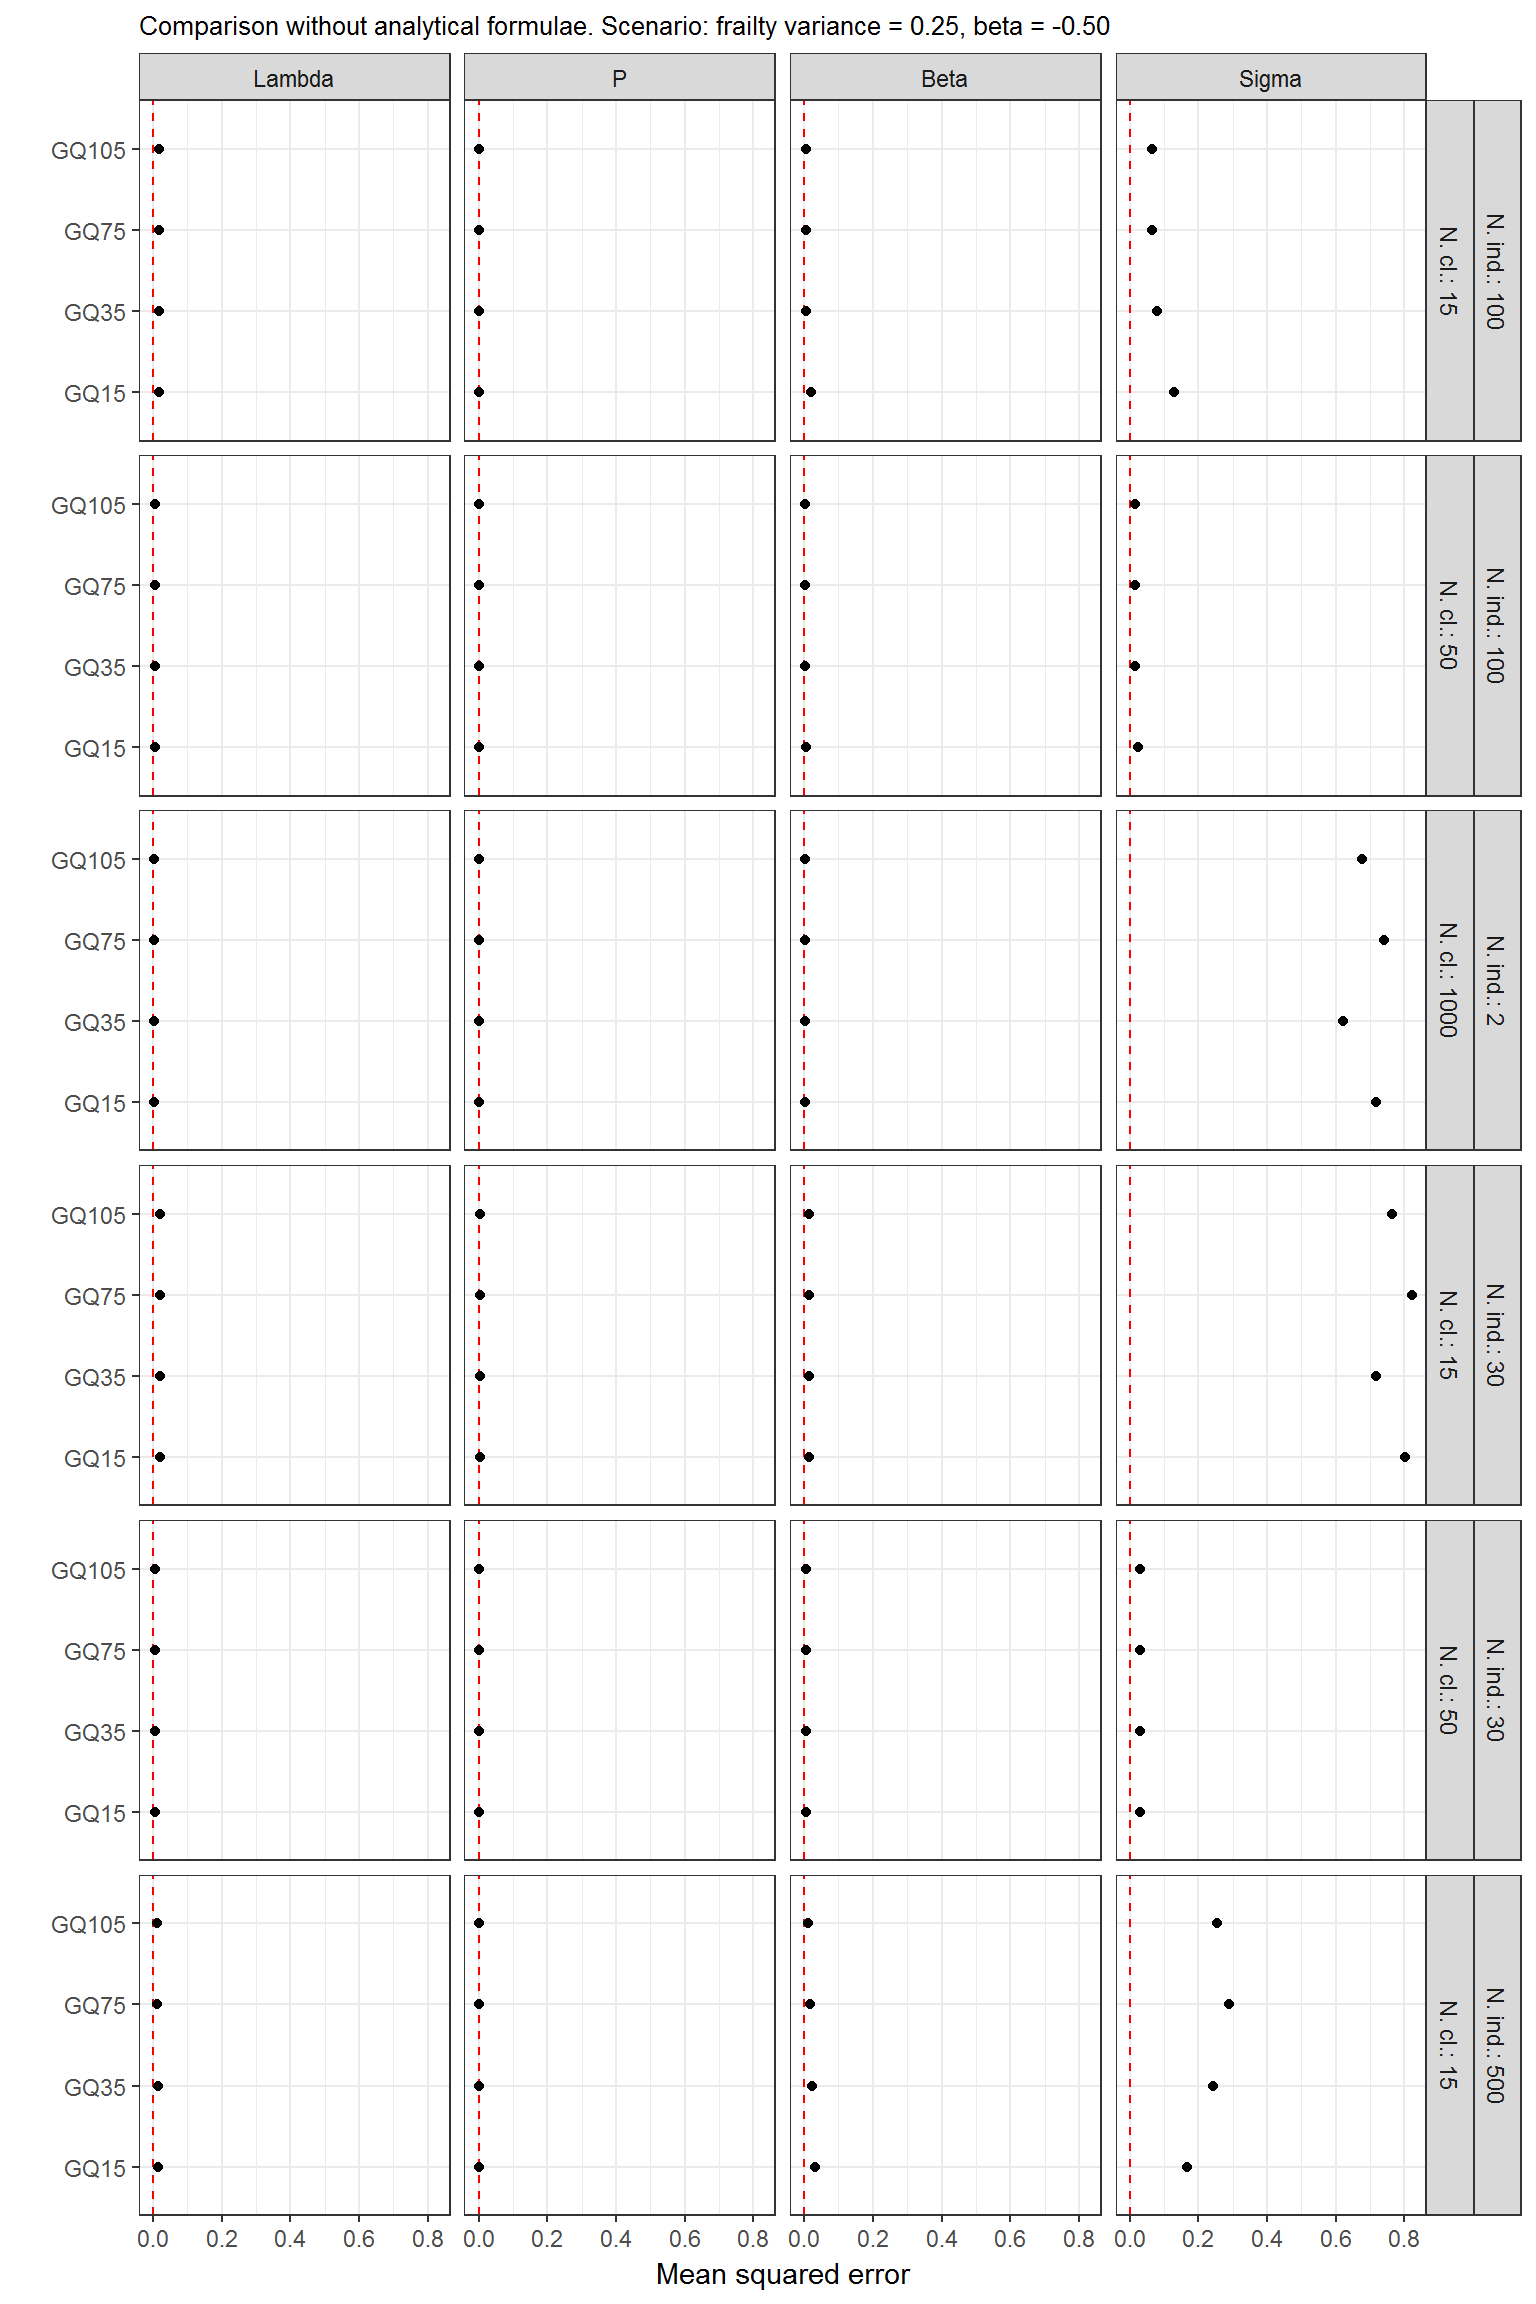
Figure B.6: Mean squared error, comparison without analytical formulae, scenario with a small frailty variance and a negative regression coefficient.
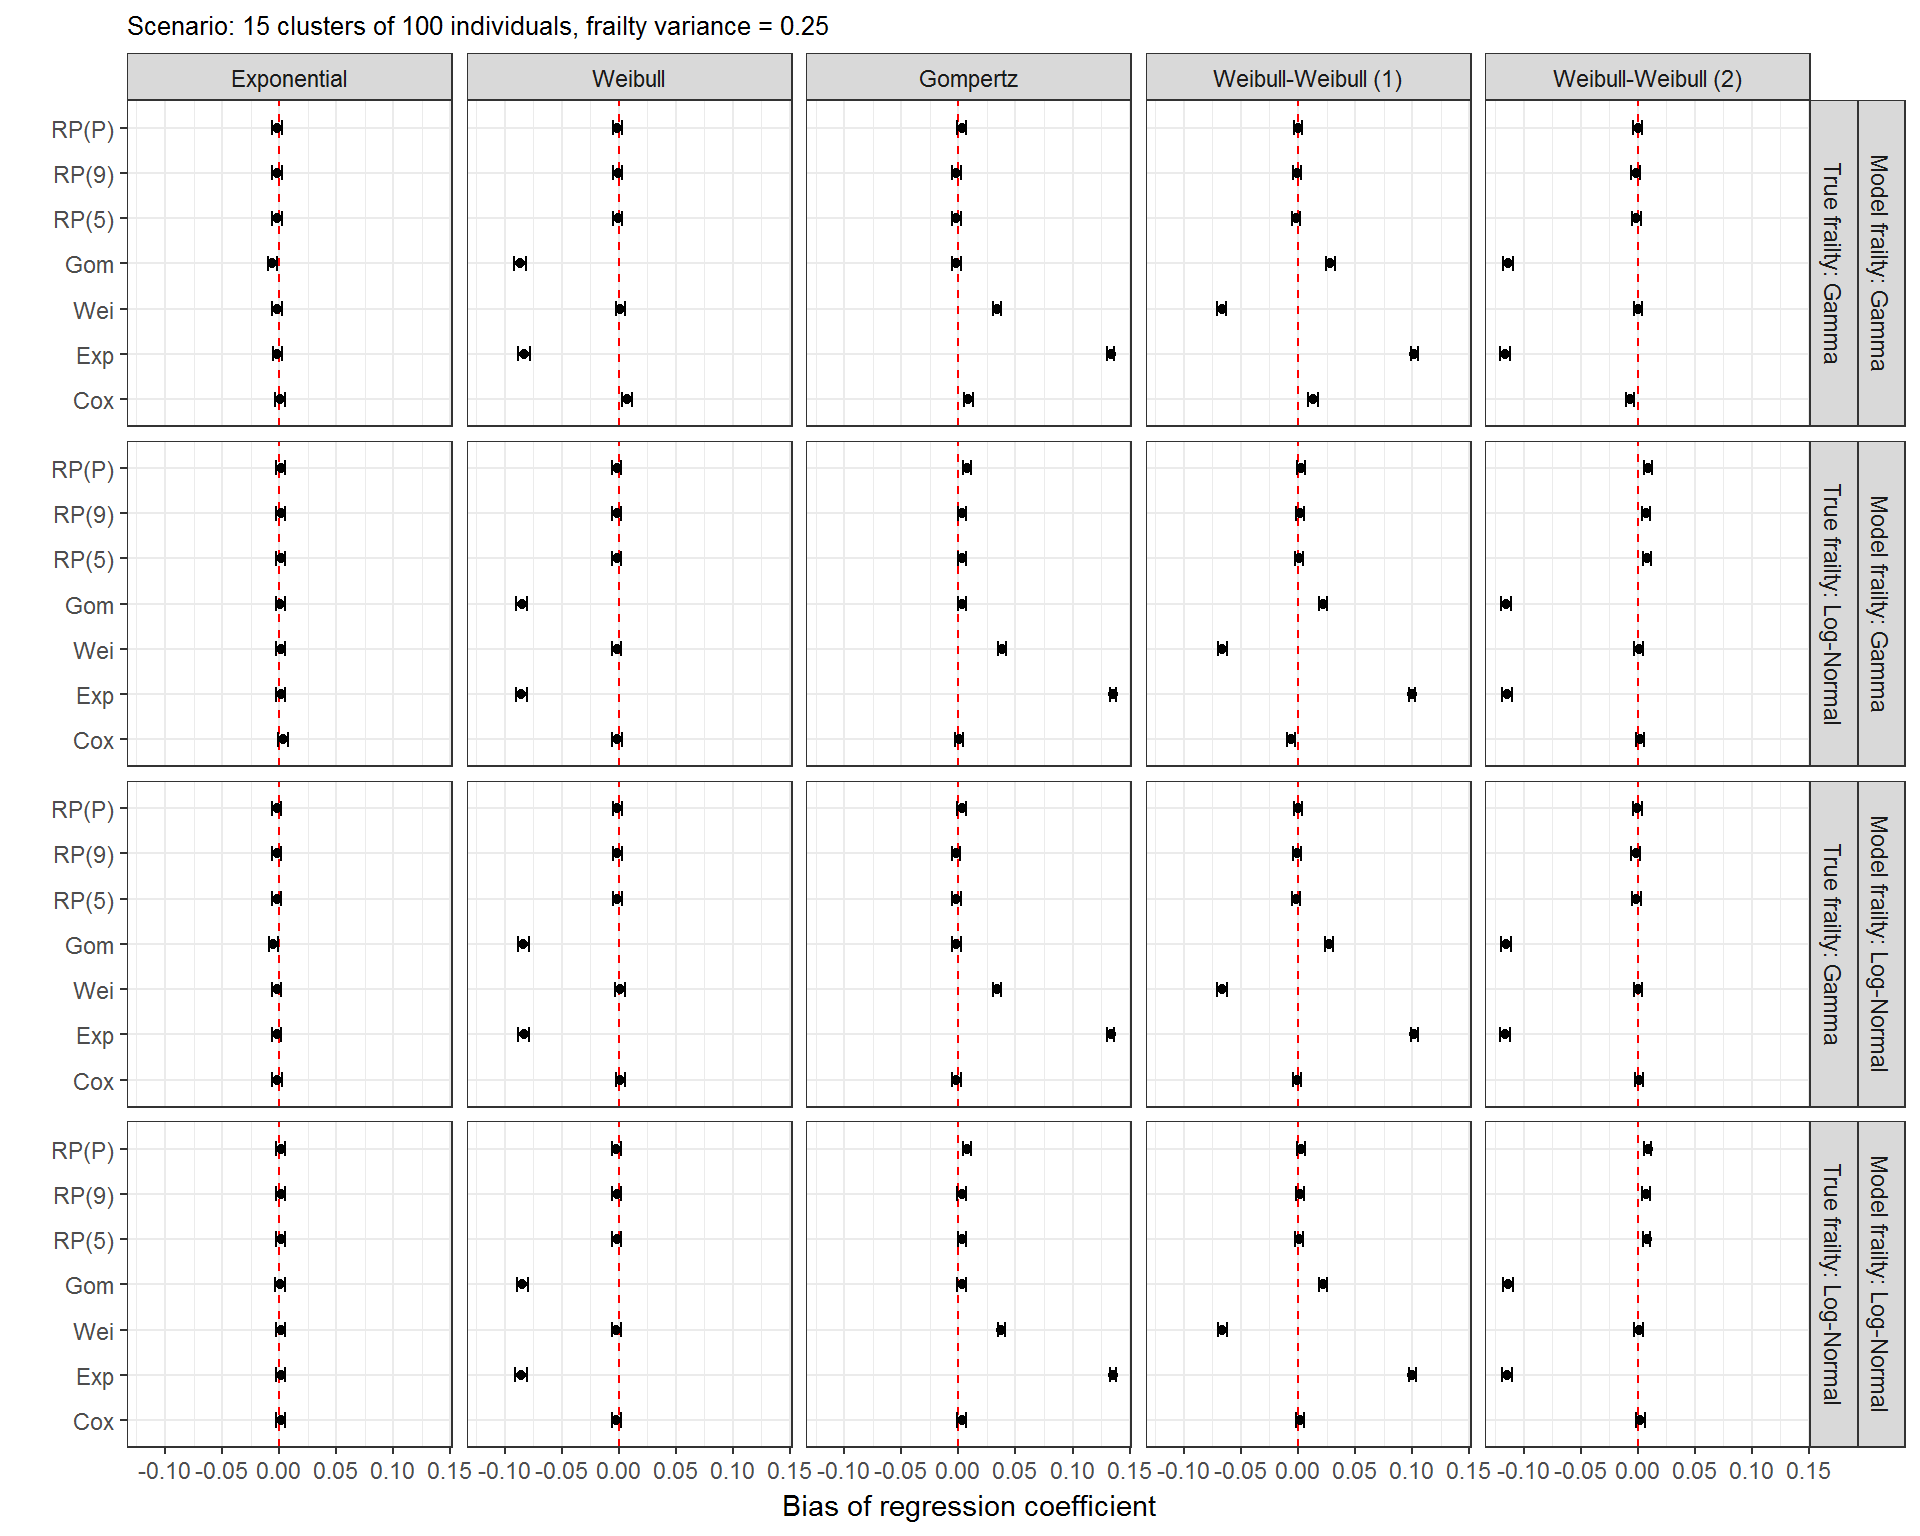
Figure B.7: Bias of estimated regression coefficient, simulation study on model misspecification in survival models with shared frailty terms, scenario with 15 clusters of 100 individuals each and a small frailty variance.
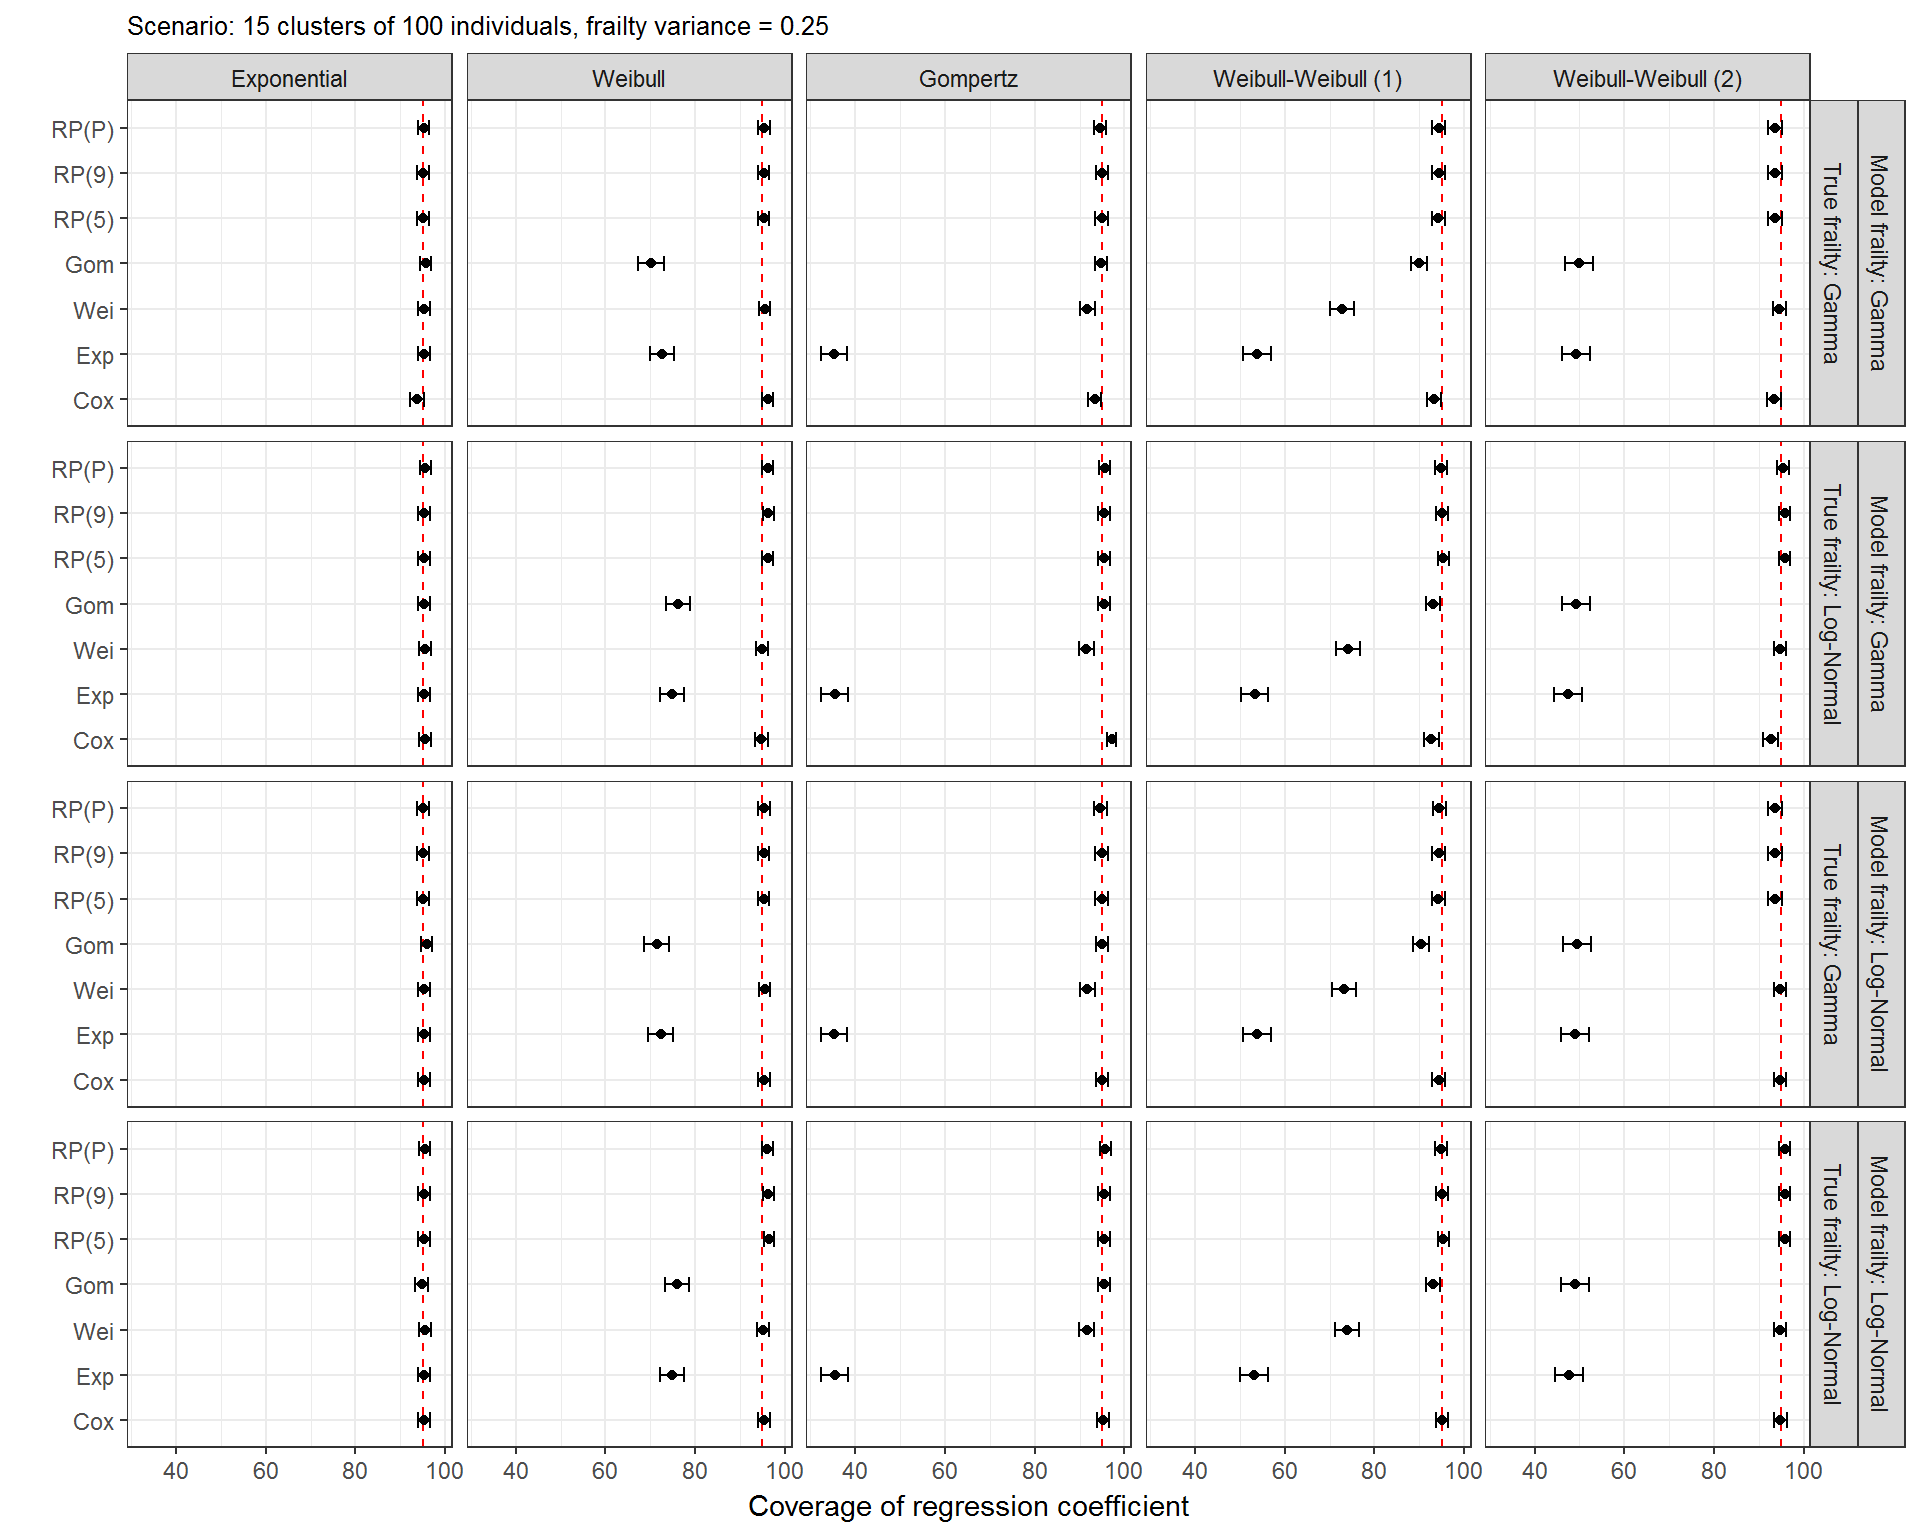
Figure B.8: Coverage of estimated regression coefficient, simulation study on model misspecification in survival models with shared frailty terms, scenario with 15 clusters of 100 individuals each and a small frailty variance.
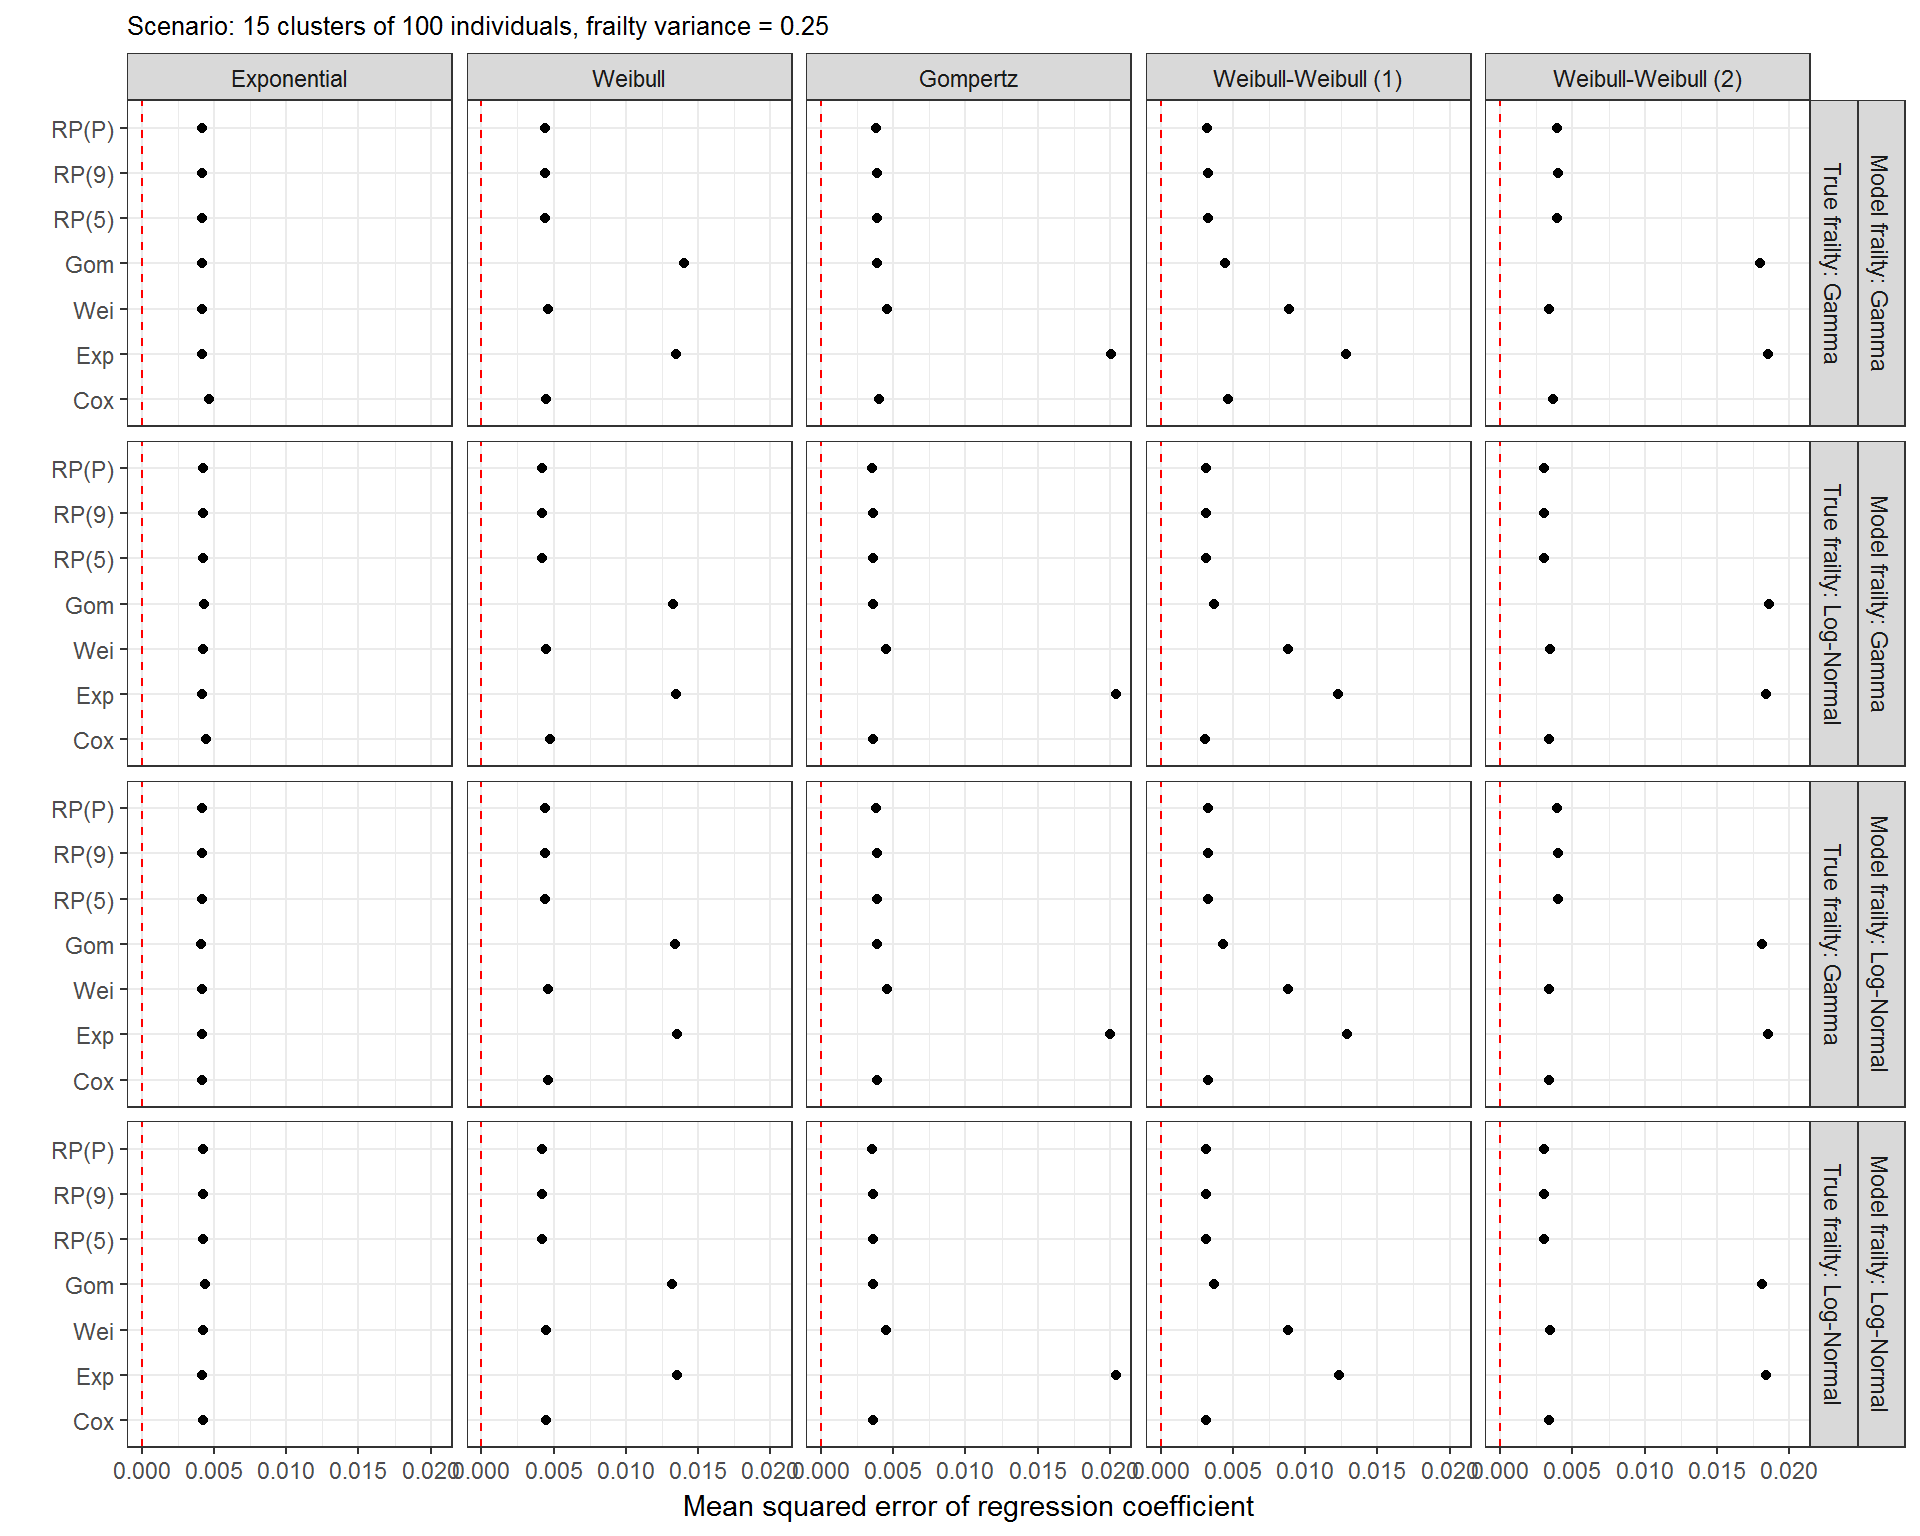
Figure B.9: Mean squared error of estimated regression coefficient, simulation study on model misspecification in survival models with shared frailty terms, scenario with 15 clusters of 100 individuals each and a small frailty variance.
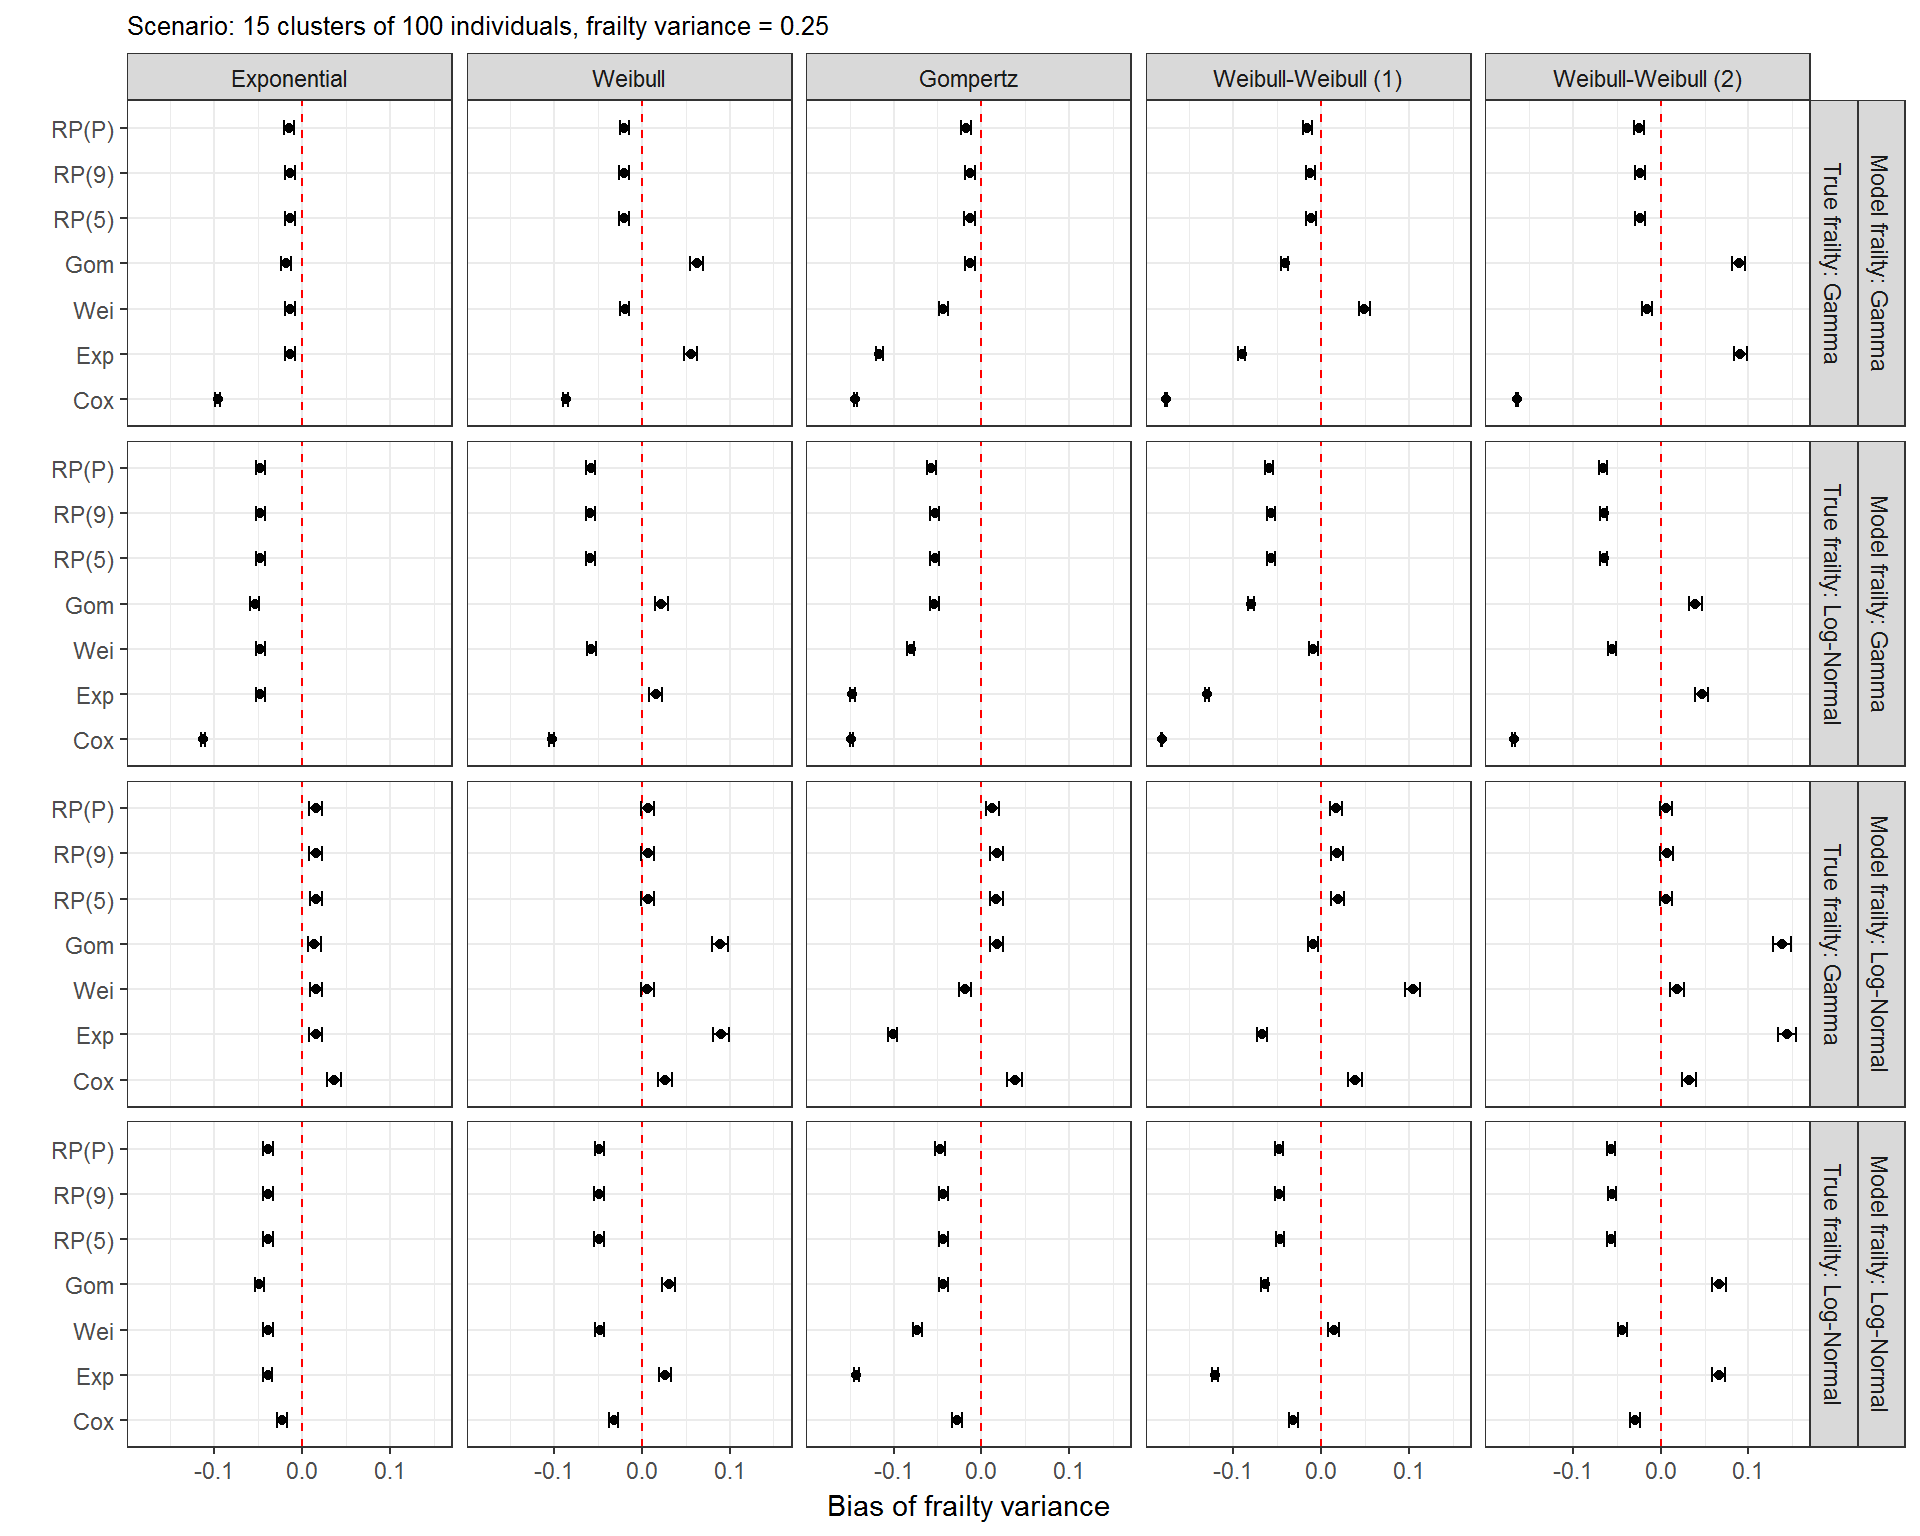
Figure B.10: Bias of estimated frailty variance, simulation study on model misspecification in survival models with shared frailty terms, scenario with 15 clusters of 100 individuals each and a small frailty variance.
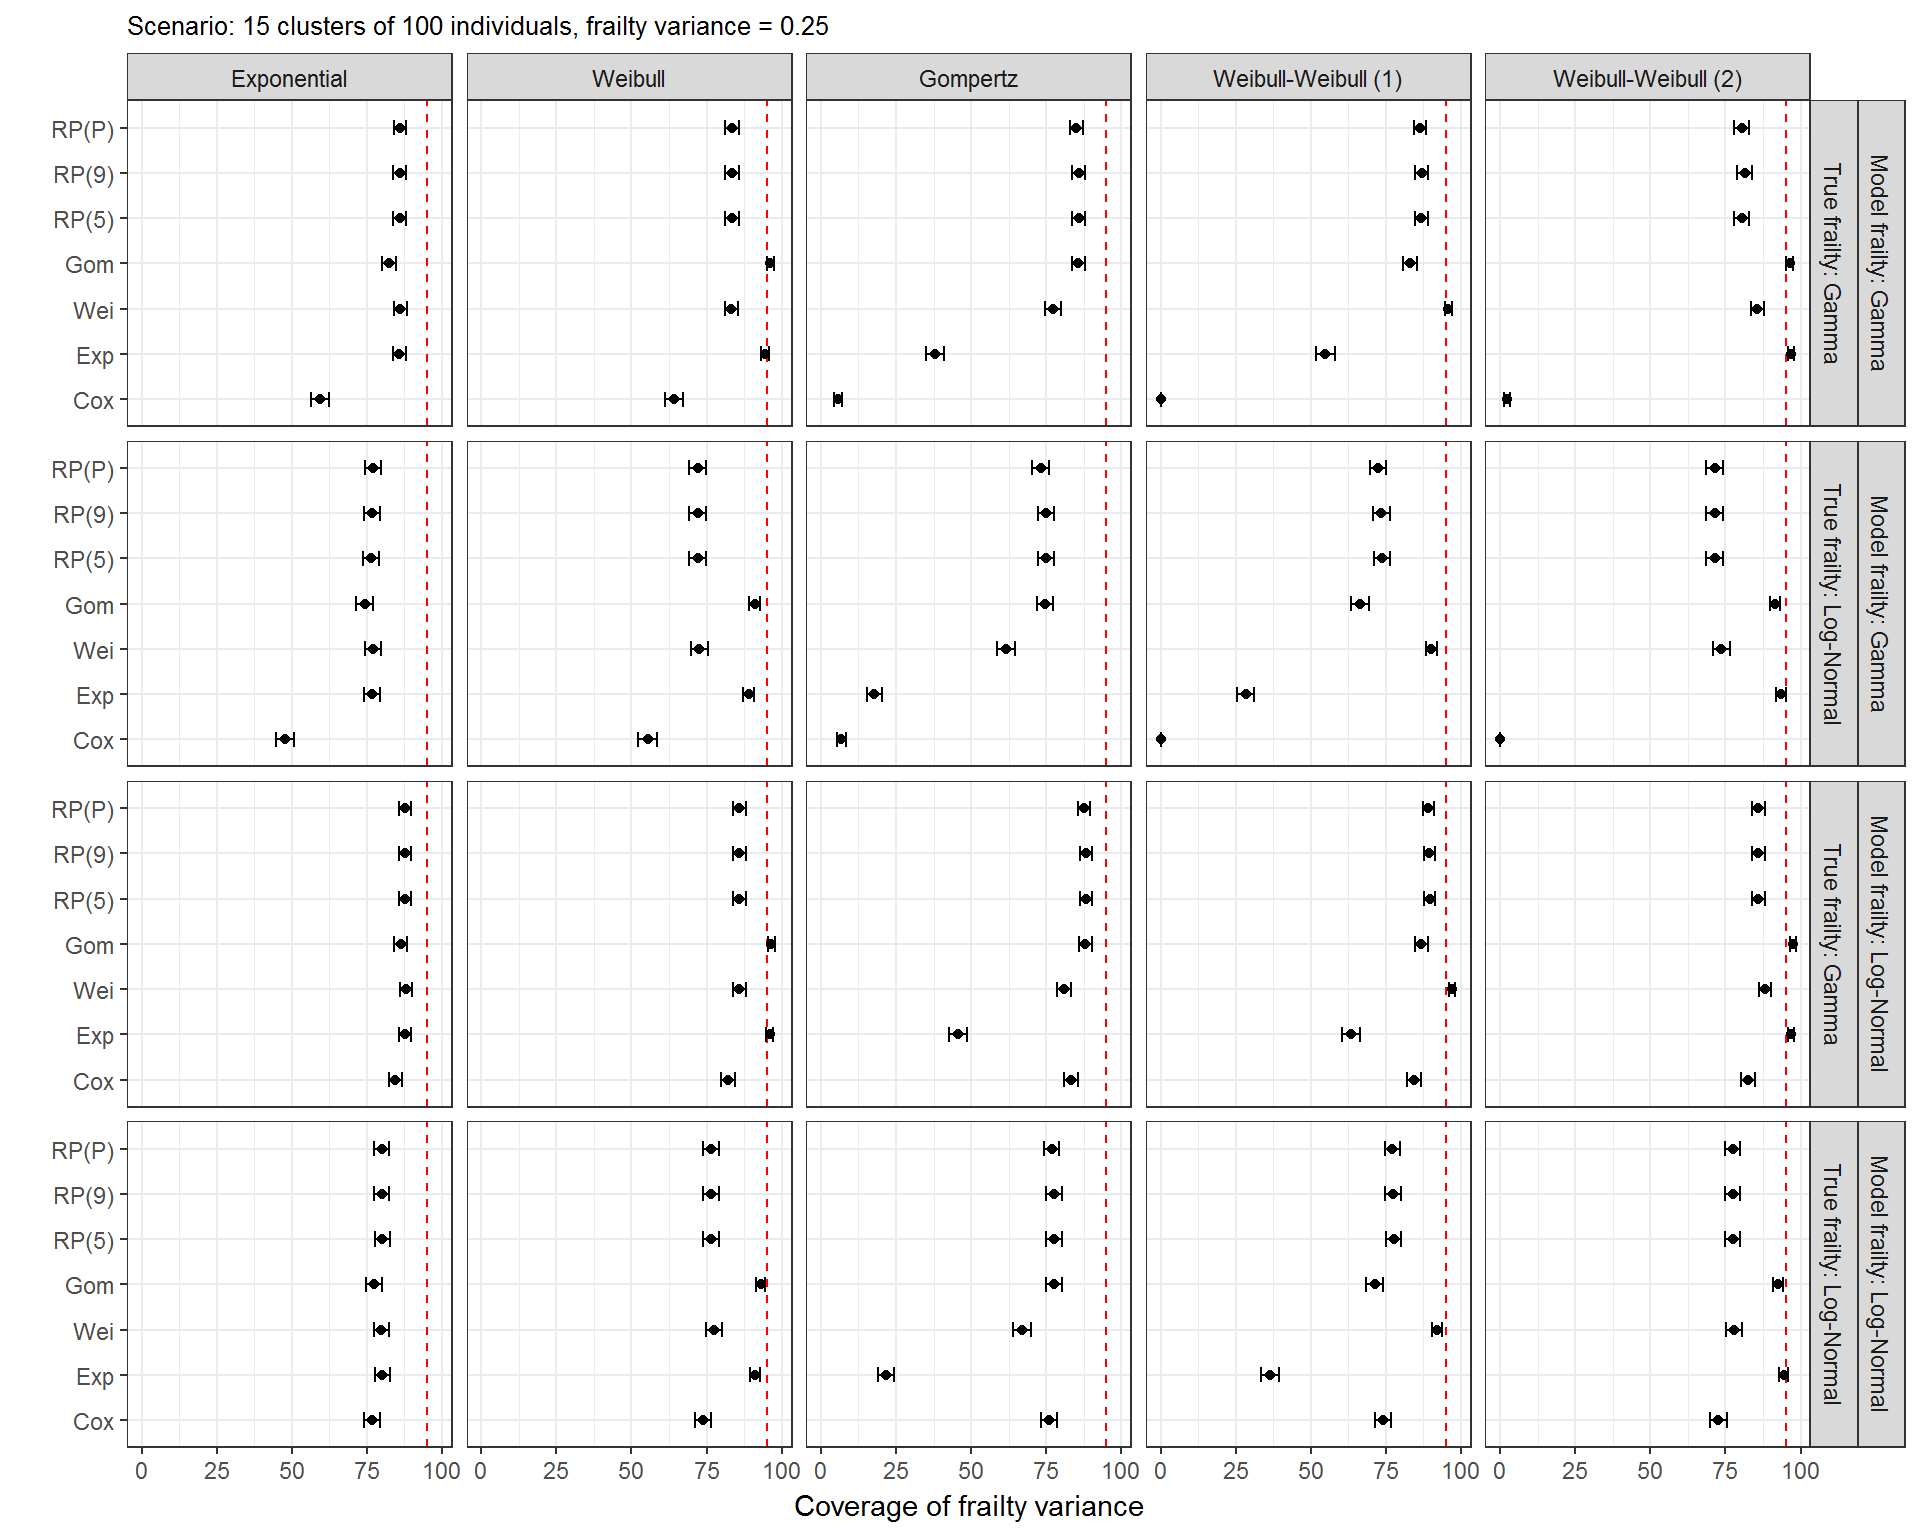
Figure B.11: Coverage of estimated frailty variance, simulation study on model misspecification in survival models with shared frailty terms, scenario with 15 clusters of 100 individuals each and a small frailty variance.
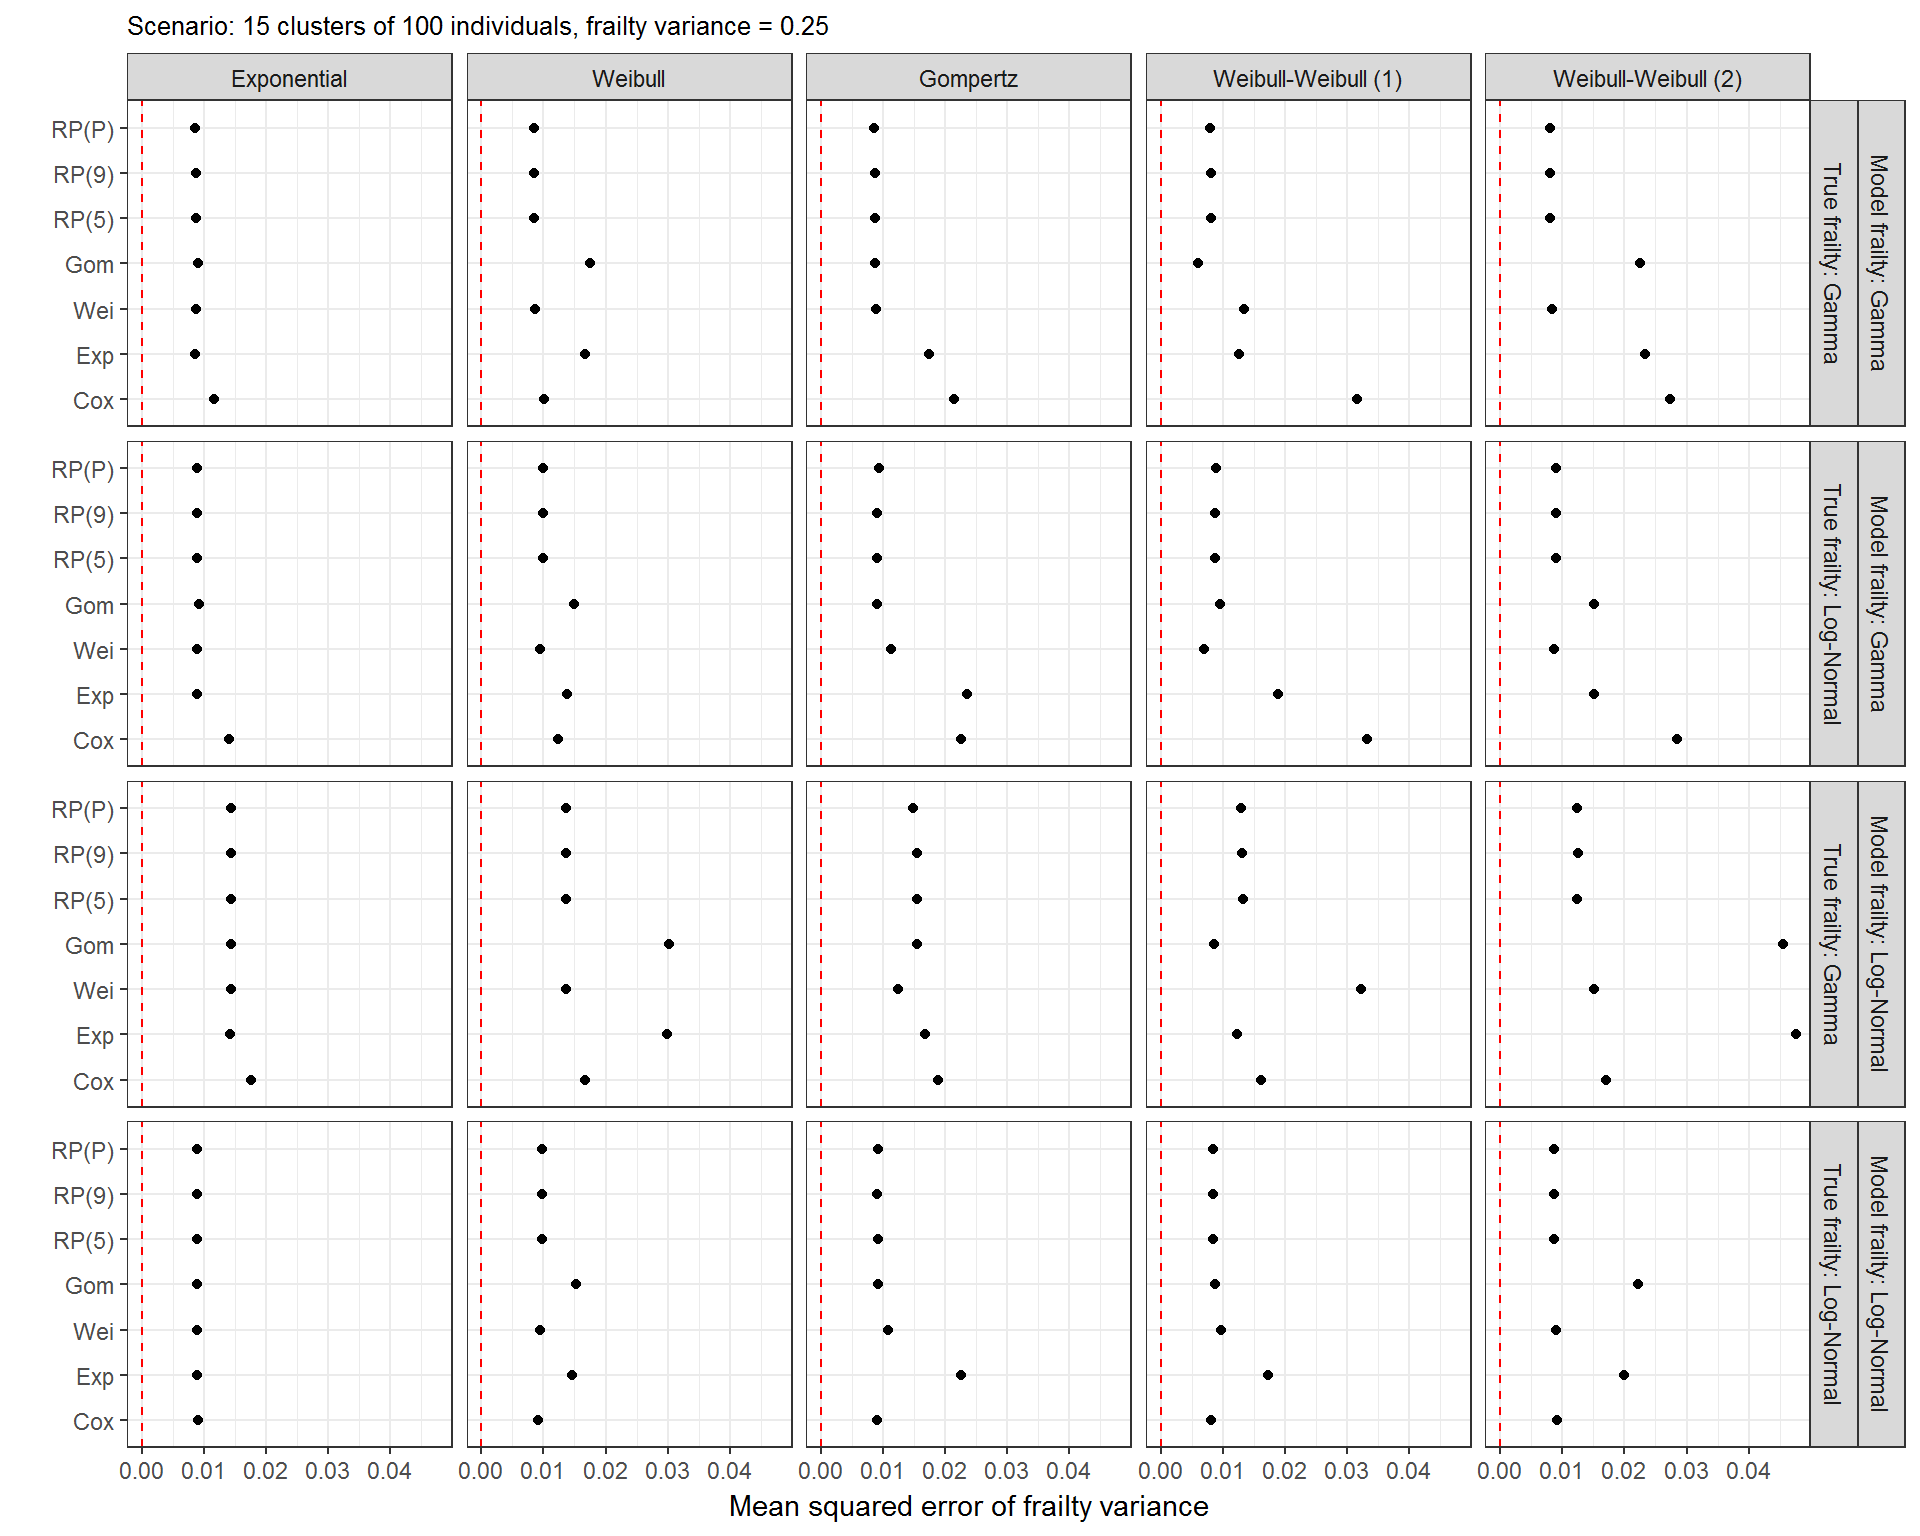
Figure B.12: Mean squared error of estimated frailty variance, simulation study on model misspecification in survival models with shared frailty terms, scenario with 15 clusters of 100 individuals each and a small frailty variance.
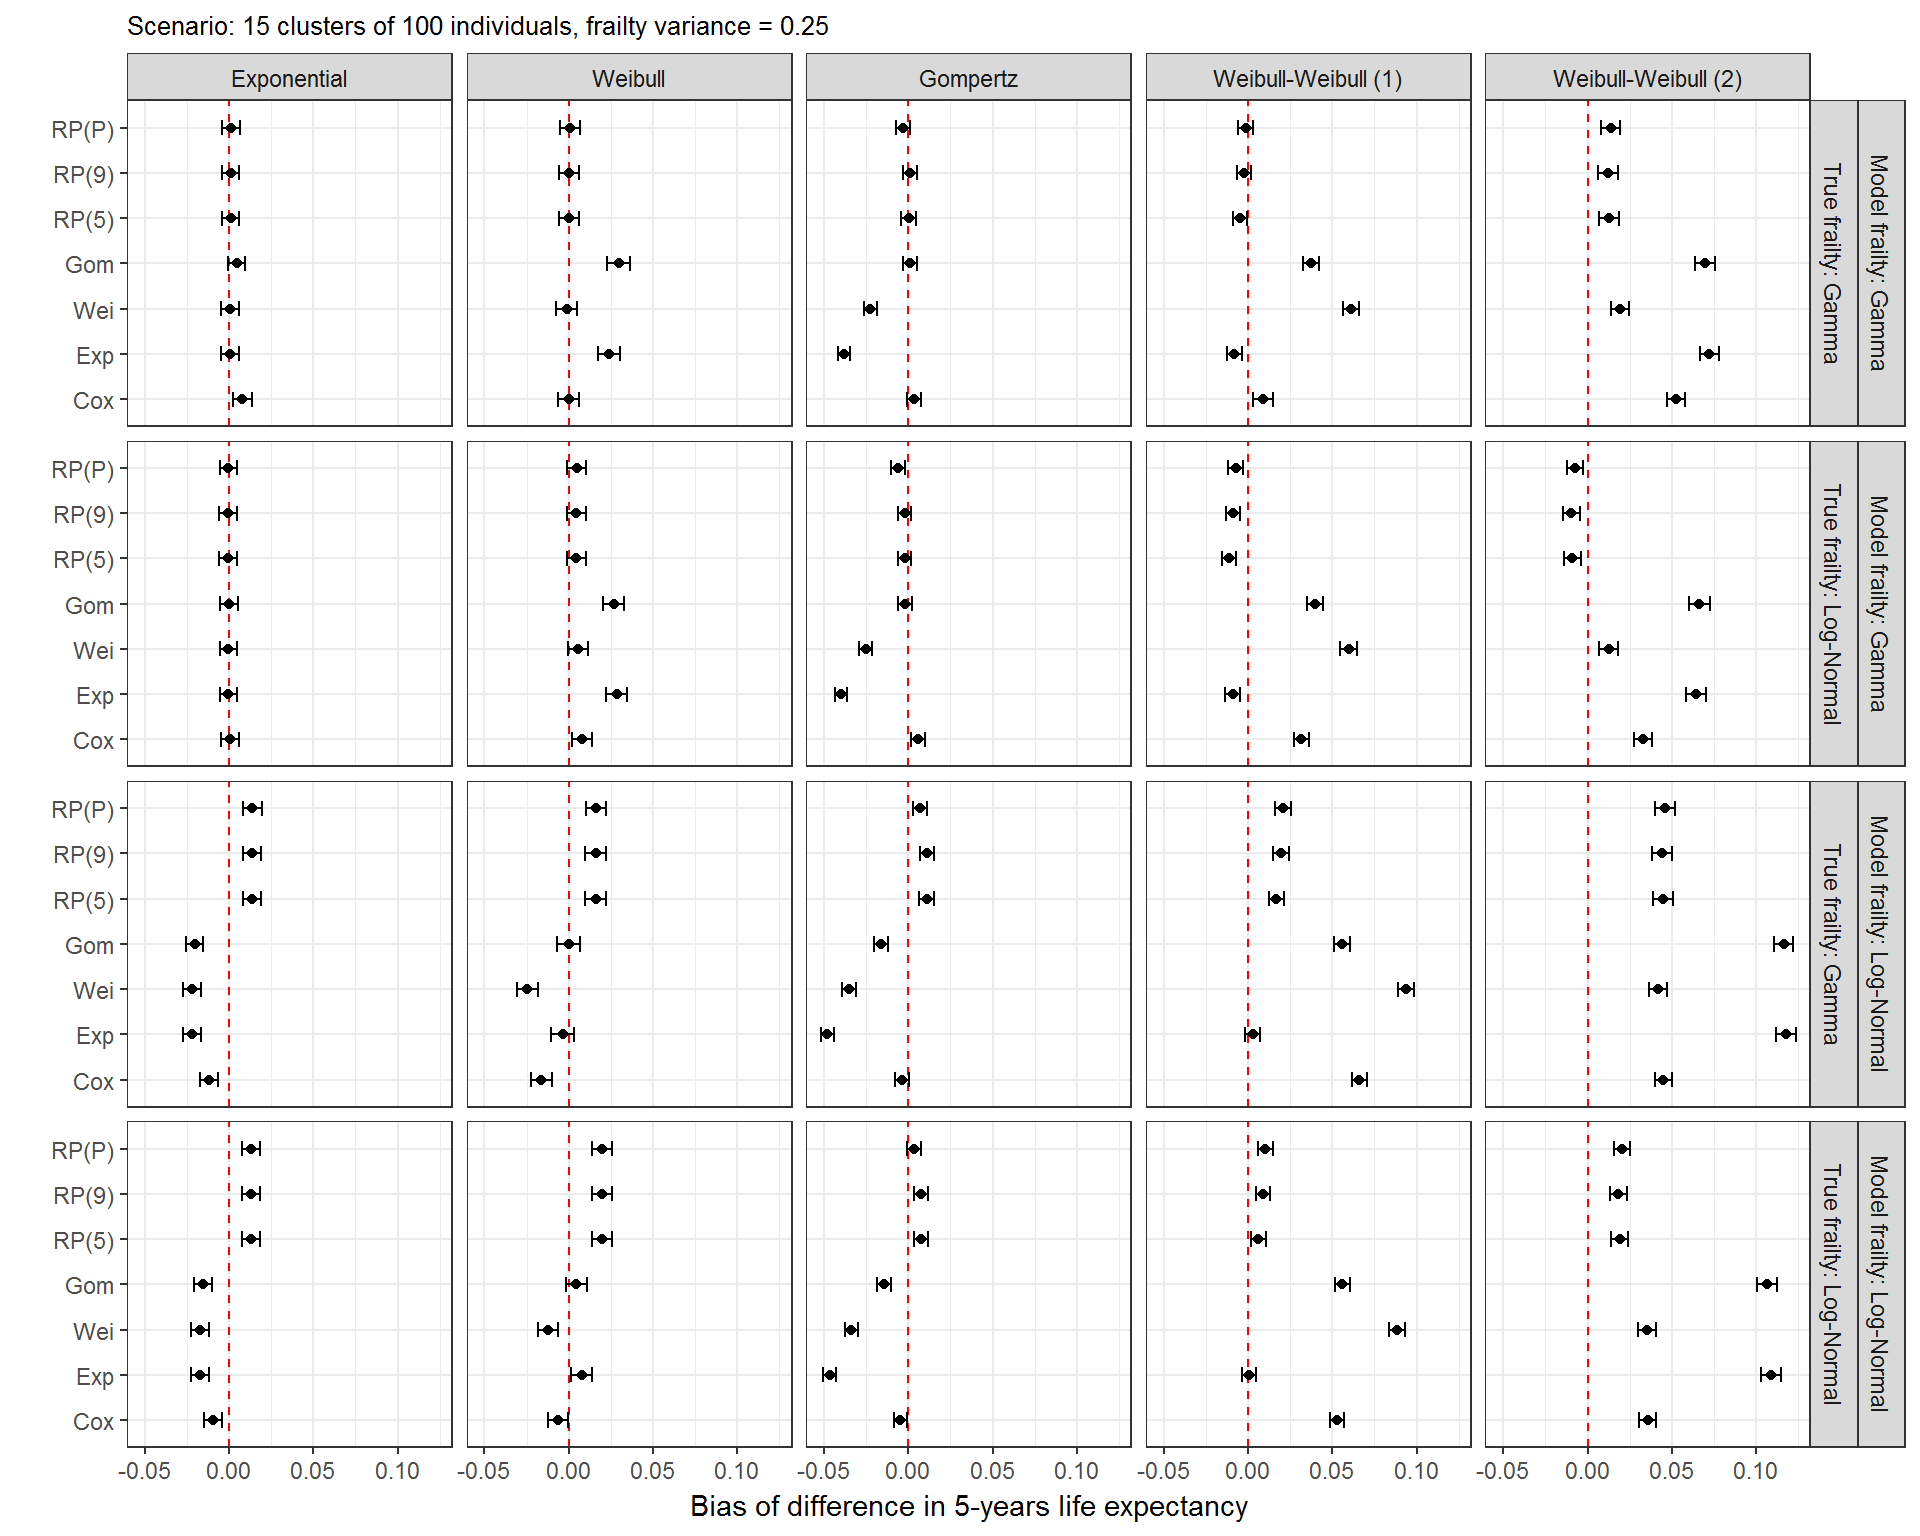
Figure B.13: Bias of estimated difference in 5-years life expectancy, simulation study on model misspecification in survival models with shared frailty terms, scenario with 15 clusters of 100 individuals each and a small frailty variance.

Figure B.14: Mean squared error of estimated difference in 5-years life expectancy, simulation study on model misspecification in survival models with shared frailty terms, scenario with 15 clusters of 100 individuals each and a small frailty variance.