7 Exploring results from simulation studies interactively
The simulation studies I presented in Chapters 5 and 6 presented multiple challenges, one of them being how to present the results effectively given the amount of simulated scenarios (108 and 150 scenarios for simulation 1 and 2, respectively). Each scenario would require producing a variety of tables and plot for bias, coverage, and any other summary statistics I may be interested in: the amount of tables and plots would grow dramatically to an unsustainable number. A straightforward (and often used in practice) option could be selecting a handful of scenarios to present, limiting the number of tables and plots to what is believed to be most interesting. However, a reader may find other scenarios more interesting, or would like to compare different factors or even dig deeper into the results; presenting only a subset of results may result limiting to some extent then. Facing this problem myself, I set out to develop an interactive tool to aid exploration and dissemination of results from simulation studies. Part of this work was presented in oral form at the Students’ Day of the 38th Conference of the International Society for Clinical Biostatistics; slides are attached in Appendix C.3.
Simulation studies represent a powerful tool with a multiplicity of aims: among others, evaluating new or existing statistical methods, comparing them, assessing the impact of modelling assumption violations, and helping with the understanding of statistical concepts. The increased availability of powerful computational tools (both personal and high-performance cluster computers) to the average researcher surely contributed to the rise of simulation studies in the current literature. Searching on PubMed and Scopus with the query “simulation study” it is indeed possible to appreciate the greater use of this tool (Figure 7.1). Additionally, increased computational capabilities allow researchers to simulate an ever-growing number of scenarios, exploring multiple data-generating mechanisms, factors, and methods at once - making reporting results a non-trivial task.
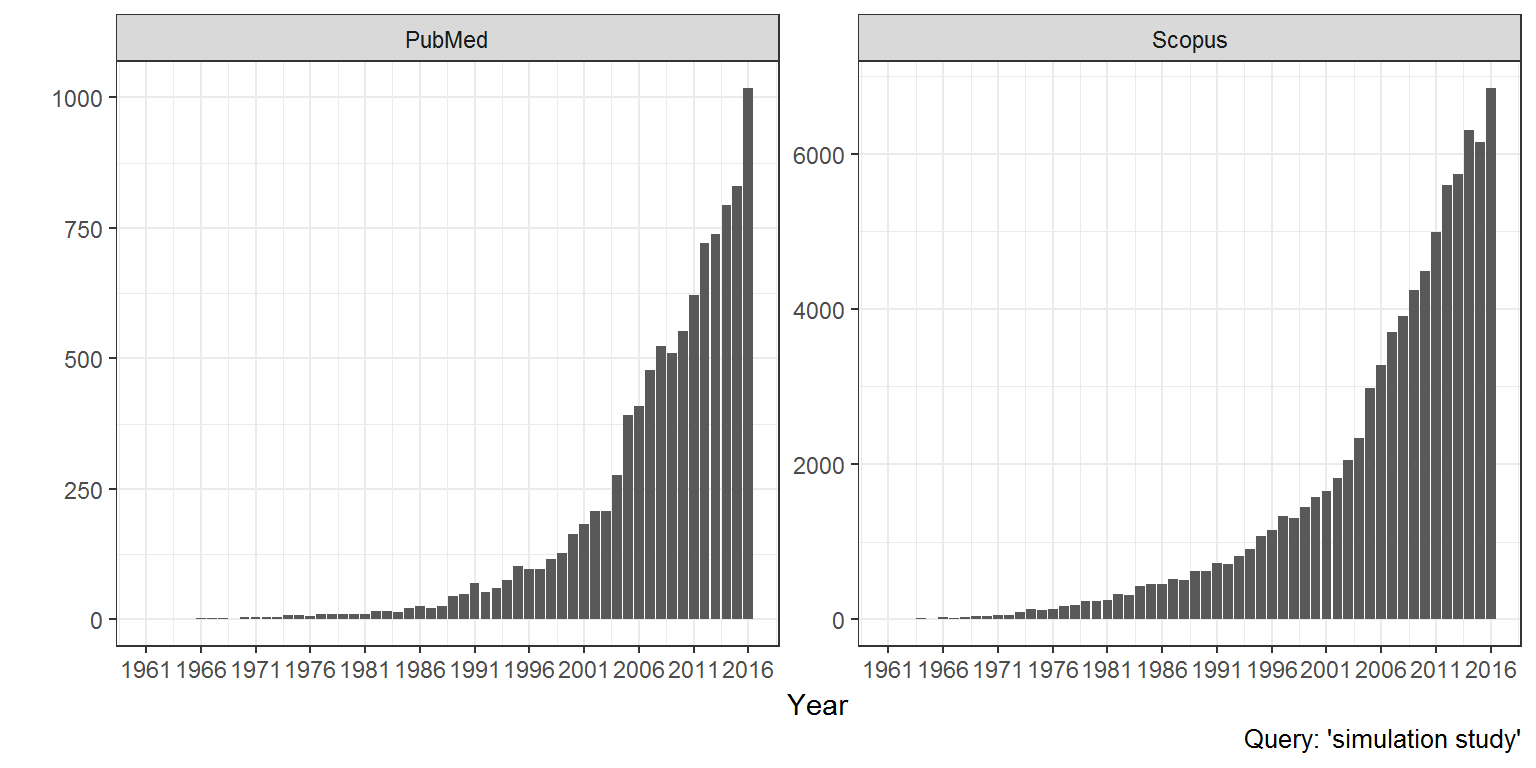
Figure 7.1: Numer of results querying ‘simulation study’ on Pubmed and Scopus.
It is necessary to bear in mind that dissemination of results plays a focal role in simulation studies:
it can drive practitioners and applied statisticians to methods that have been shown to perform well in their practical settings (e.g.: small sample size, high proportion of missing values);
it can guide researchers to develop new methods in a promising direction;
it can provide insights into less established methods.
As a consequence, several design and reporting guidelines emerged, often tailor-made to a specific research area (e.g. health technology assessment, medical statistics, social sciences). Despite that, challenges still persist and further research is needed into methods to help reporting of results.
To bridge the gap between the number of scenarios a researcher can simulate from and dissemination of results, I developed a tool for exploring results interactively. The tool is developed using R and shiny (https://shiny.rstudio.com/), a web application framework for R that allows creating interactive web applications in a straightforward way.
I named the interactive tool SiReX, acronym for Simulation Results eXplorer. It requires the researcher to upload a dataset in a standardised, tidy format (observations are in rows, variables are in columns) containing results from a simulation study. Then, it computes performance measures such as bias, coverage probability, Monte Carlo errors, and empirical standard errors automatically. Finally, it presents results and performance summaries both in tabular and graphical fashion (via bar plots and lolly plots) and allows the reader to vary simulation parameters and choose estimands of interest for further investigations.
A typical workflow with SiReX would consist of the following steps:
- Upload a dataset with results from a simulation study in a tidy format compatible with the tool (Figure 7.2);
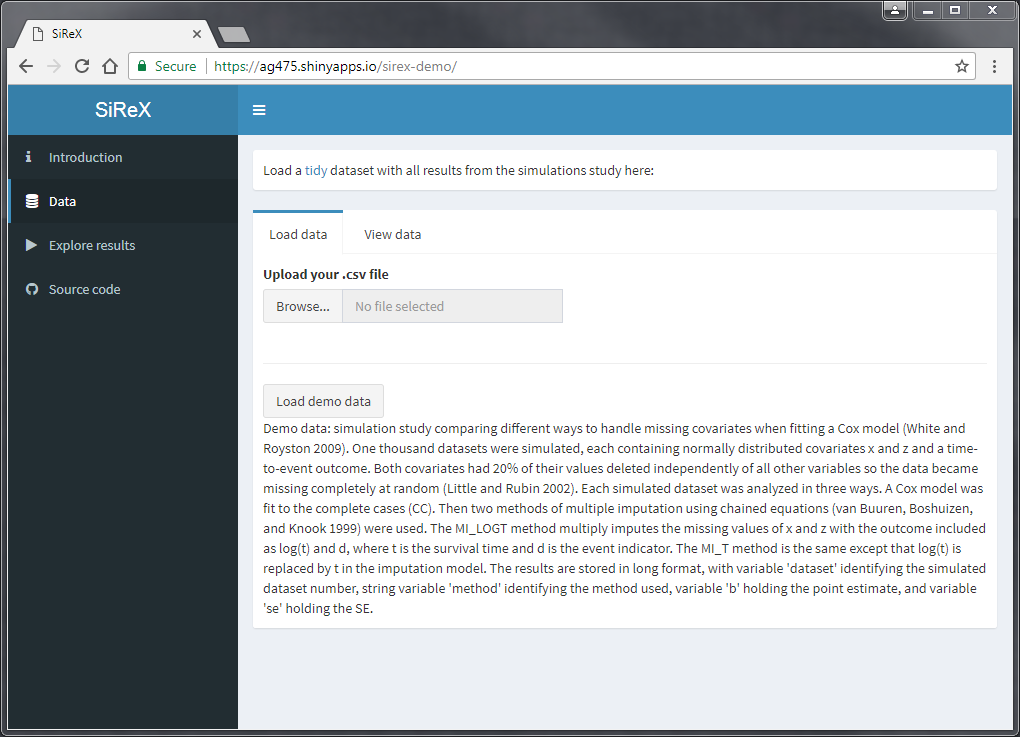
Figure 7.2: SiReX: load a dataset
- Summary statistics are computed automatically (Figure 7.3);
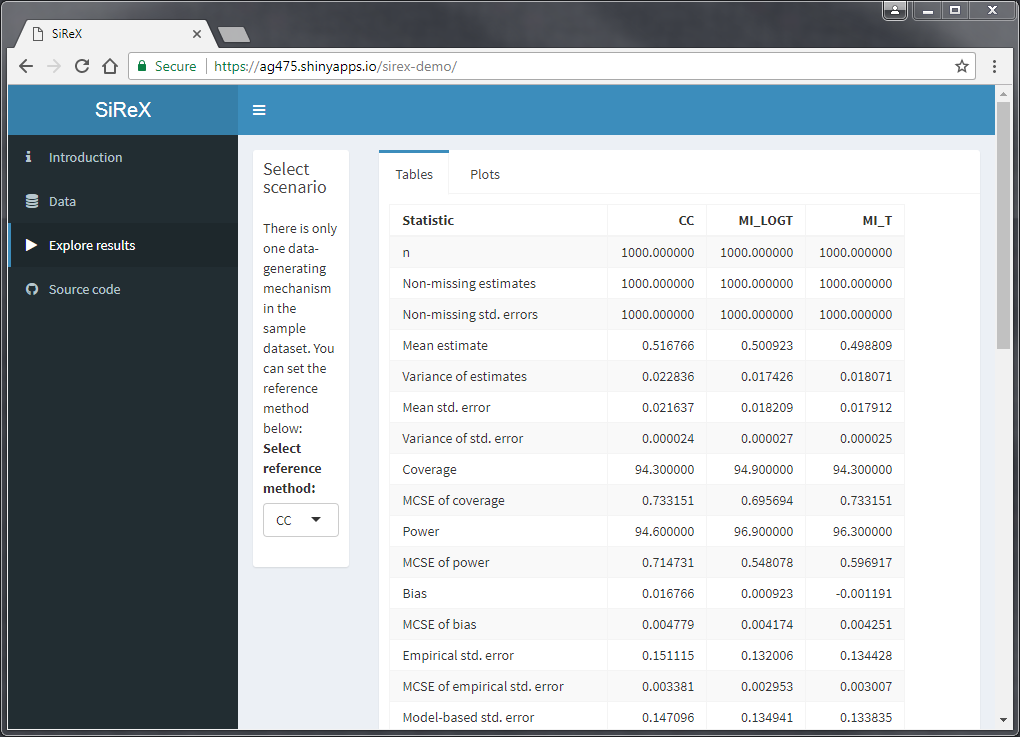
Figure 7.3: SiReX: table with summary statistics, computed automatically
Factors identifying different data-generating mechanisms are identified automatically and drop-down menus are populated appropriately;
Now, it is possible to select and change data-generating mechanisms: summary tables and plots are updated automatically (Figure 7.4);
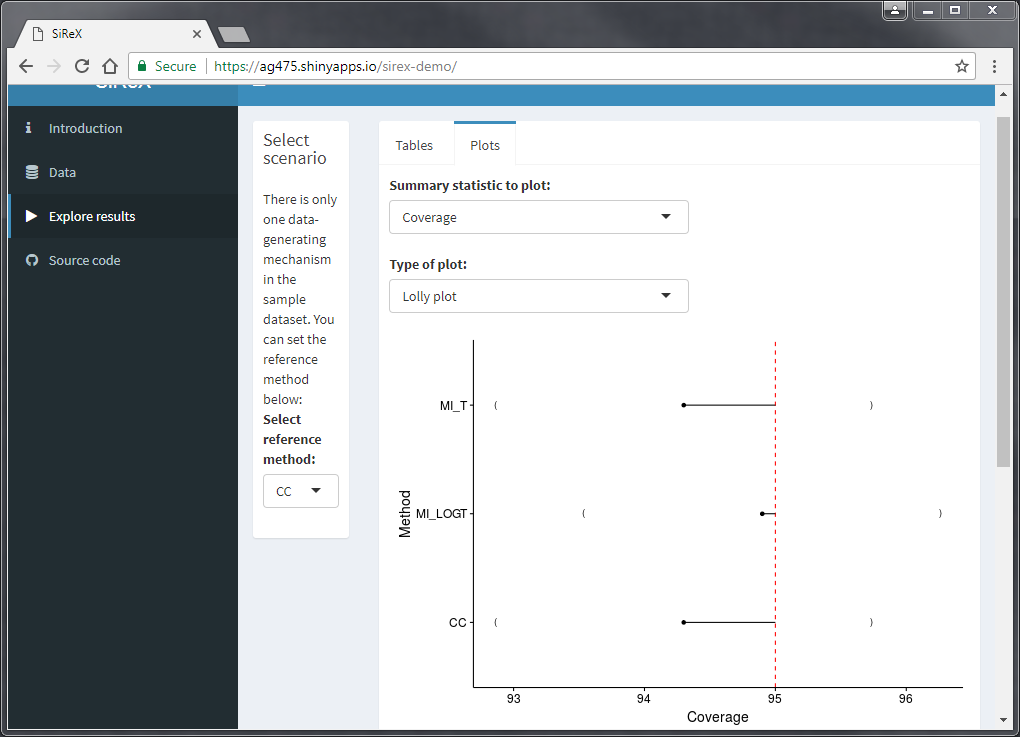
Figure 7.4: SiReX: plots are created and updated automatically
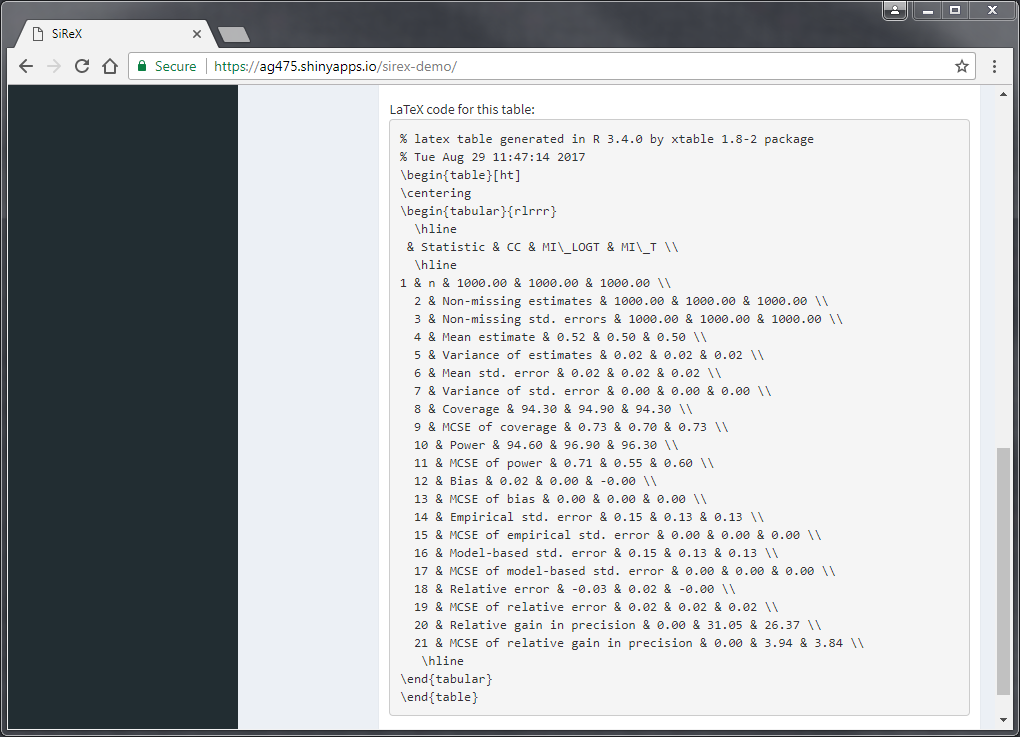
Figure 7.5: SiReX: export tables in LaTeX format
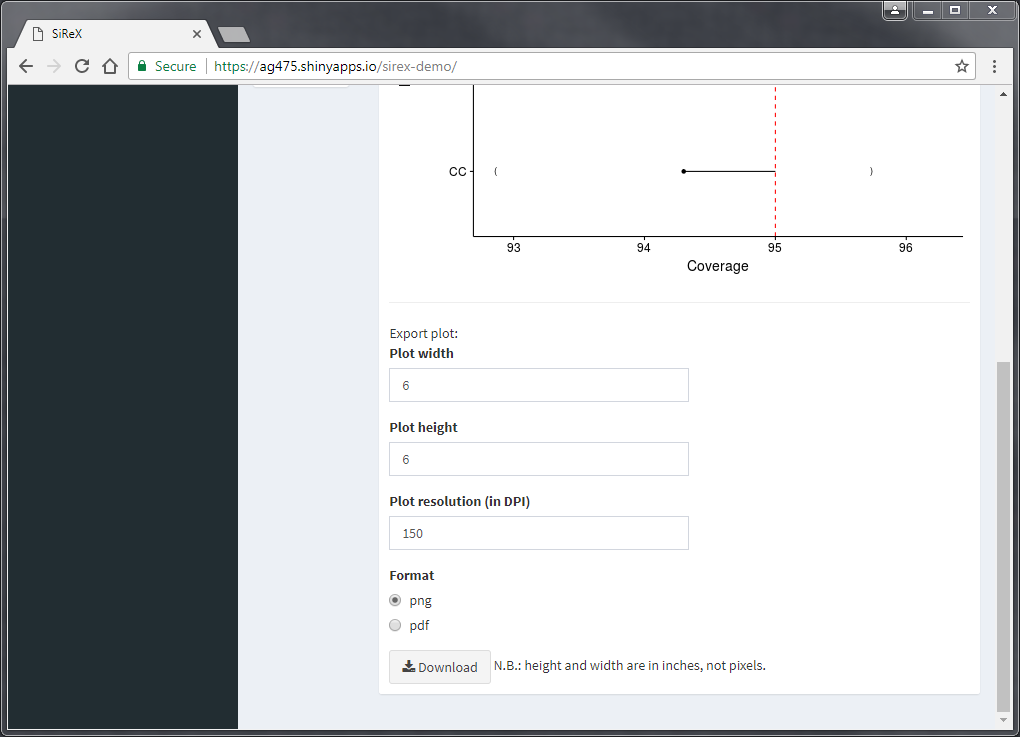
Figure 7.6: SiReX: export plots
A current live demo of the tool is available at https://ag475.shinyapps.io/sirex-demo/, using an example dataset from a simulation study on multiple imputation. Nevetheless, SiReX is still under active development and changes are implemented on a constant basis; in Section 9 I will present how I aim to polish it and expand it in the next months.