6.2 Data-generating mechanisms
I simulate data under five different baseline hazard functions using the approaches of Bender, Augustin, and Blettner (2005) and Crowther and Lambert (2013): Exponential, Weibull, Gompertz, and a two different two-components mixture Weibull-Weibull with turning points. In practice, I choose the following hazard functions: exponential with scale \(\lambda\) = 0.3, Weibull with scale \(\lambda\) = 0.5 and shape \(p\) = 0.6, Gompertz with scale \(\lambda\) = 0.1 and shape \(\gamma\) = 0.5, two-components mixture Weibull with scale parameters \(\lambda_1\) = 0.5, \(\lambda_2\) = 0.3, shape parameters \(p_1\) = 2.5 and \(p_2\) = 1.3, and mixing parameter \(\pi\) = 0.8, and two-components mixture Weibull-Weibull with scale parameters \(\lambda_1\) = \(\lambda_2\) = 1.0, shape parameters \(p_1\) = 1.5 and \(p_2\) = 0.5, and mixing parameter \(\pi\) = 0.5 (Figure 6.1). Then, for all possible baseline hazard function, I generated clustered data assuming 15 clusters of (30, 100) individuals each, 50 clusters of (30, 100) individuals each, or 1000 clusters of 2 individuals each. I included a binary treatment variable \(X \sim Bin(1, 0.5)\) with associated log-hazard ratio of \(-0.5\) and cluster-specific frailty terms \(\alpha_i\) following either a Gamma or a log-normal distribution with variance \(\theta\) (\(\theta\) = {0.25, 0.75, 1.25}, Figure 6.2). Finally, I generated an event indicator variable \(d\) by applying administrative censoring at 5 years. The true marginal survival functions corresponding to these simulated settings are depicted in Figure 6.3.
I applied a fully factorial design: this resulted in 150 simulation scenarios, 5 sample sizes \(\times\) 5 baseline hazards \(\times\) 2 frailty distributions \(\times\) 3 true frailty variances.
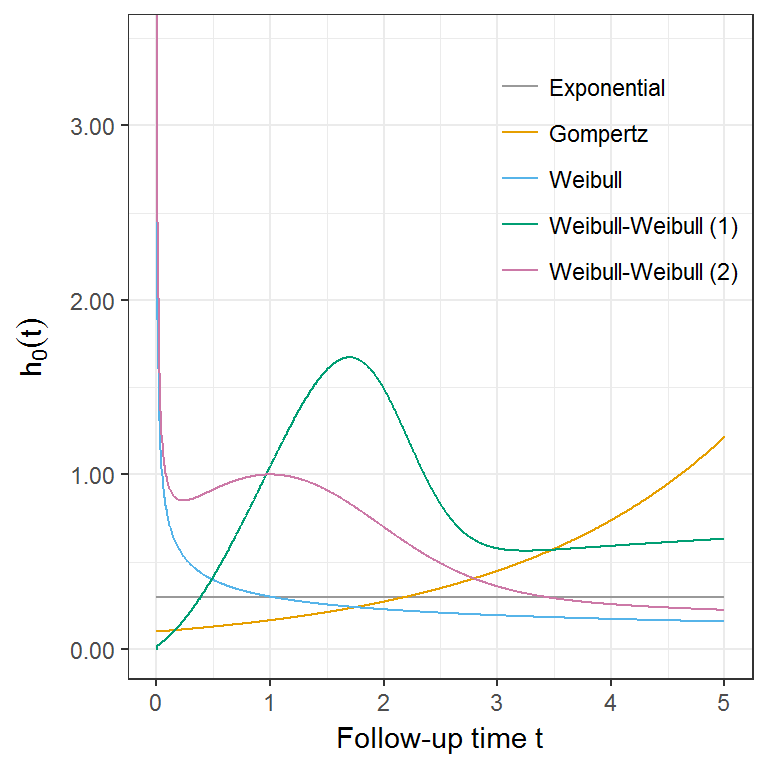
Figure 6.1: Baseline hazard functions chosen for this simulation study.
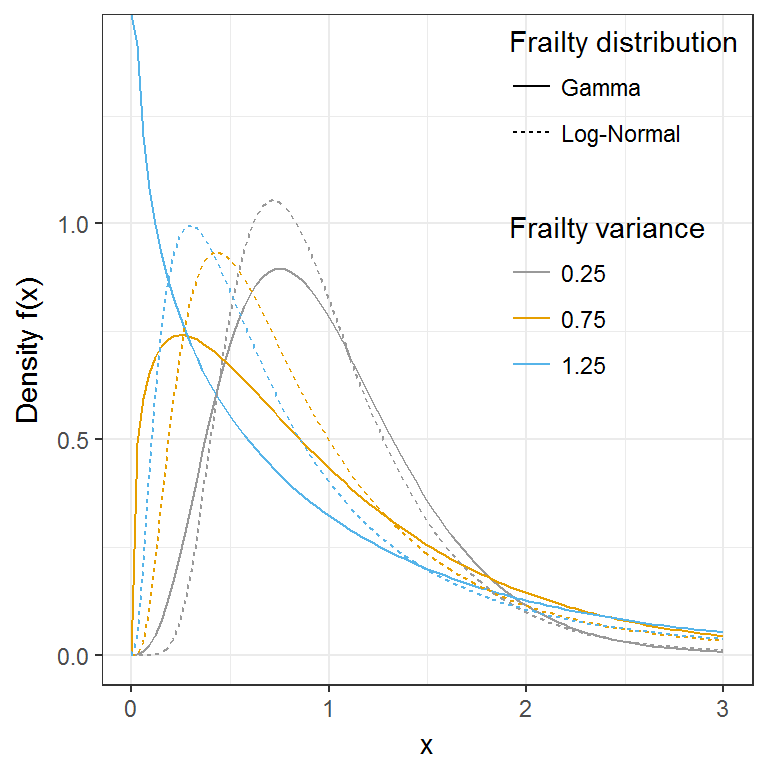
Figure 6.2: Frailty distributions chosen for this simulation study.
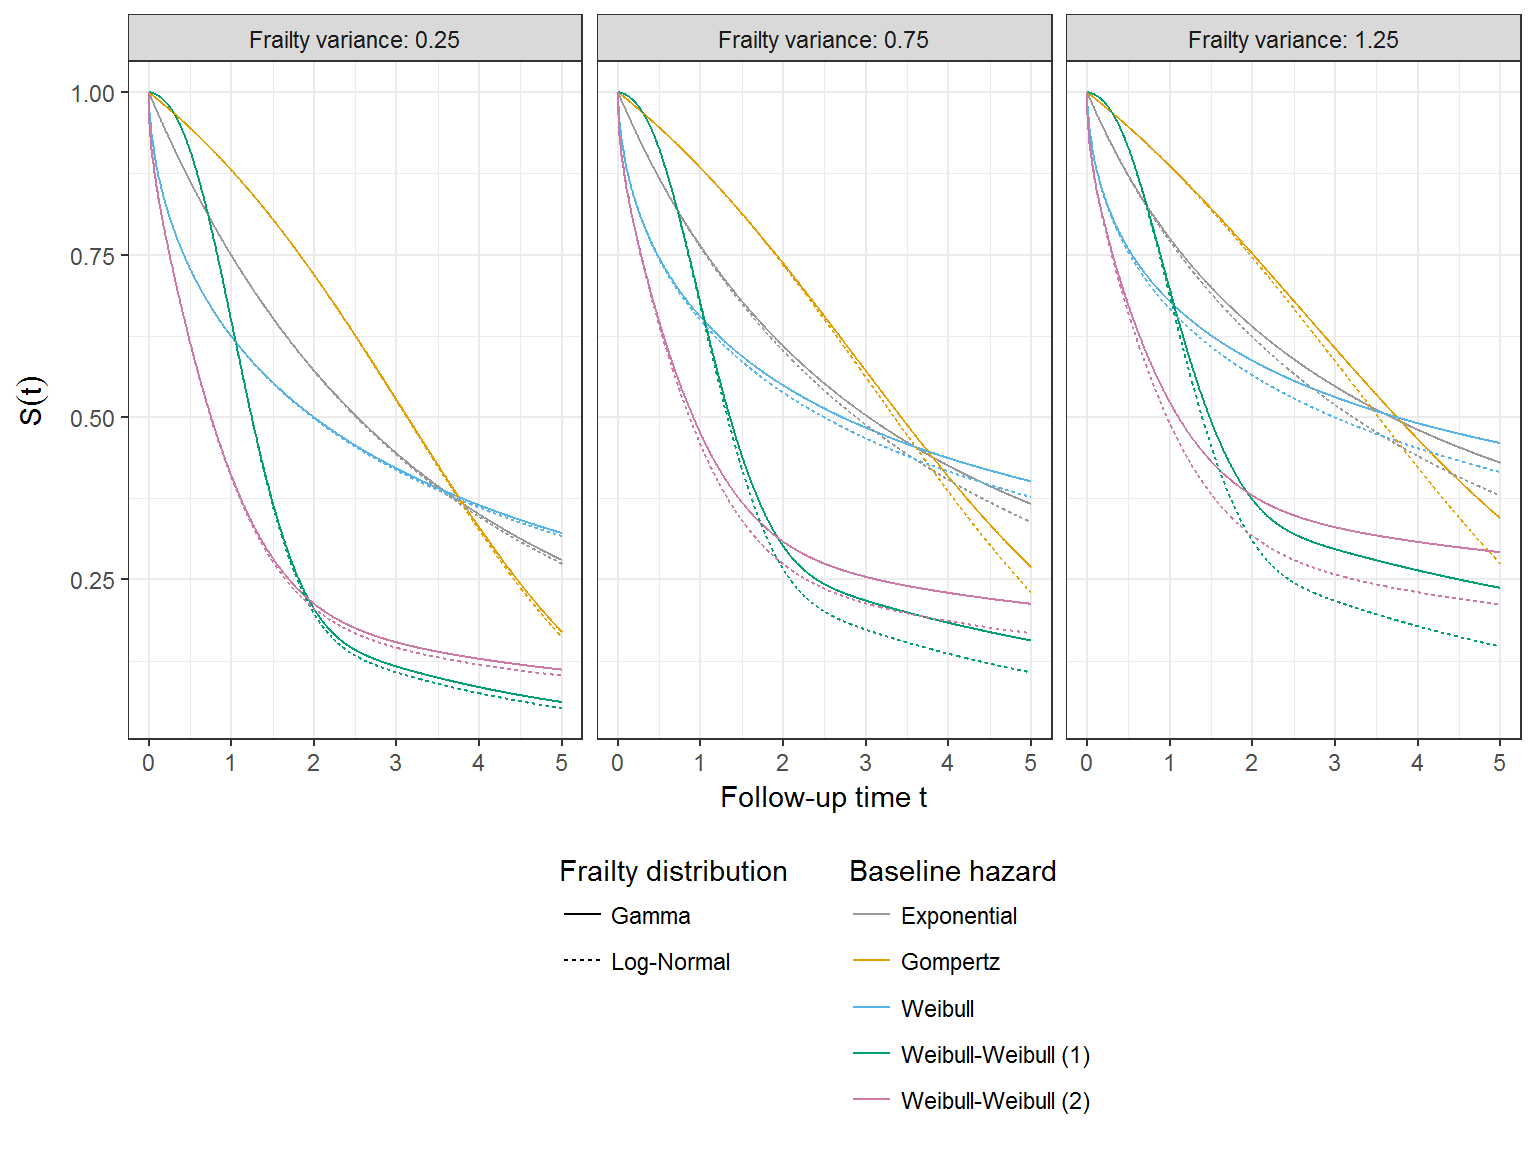
Figure 6.3: Marginal survival depending on baseline hazard and frailty distribution chosen for this simulation study.
References
Bender, Ralf, Thomas Augustin, and Maria Blettner. 2005. “Generating Survival Times to Simulate Cox Proportional Hazards Models.” Statistics in Medicine 24: 1713–23. doi:10.1002/sim.2059.
Crowther, Michael J, and Paul C Lambert. 2013. “Simulating Biologically Plausible Complex Survival Data.” Statistics in Medicine 32 (23): 4118–34. doi:10.1002/sim.5823.